Curated OER
Electric Field Mapping in 3D
Students create a 3D vector field map of an electric field. In this physics lesson, students measure the voltage inside an aquarium with water. They present their findings and map to class..
Curated OER
Impact Craters
Students investigate the factors affecting the size of a crater. In this space science instructional activity, students collect data from the activity and graph them. They explain how velocity of impact relate to crater size.
Curated OER
The Nutrients Public Transportation System
Students investigate the human circulatory system by experimenting with hoses. In this human body lesson, students create a system of hoses simulating the circulatory system which they utilize to pass objects through....
Curated OER
The Environment and Interactions of Living Organisms
Students study the environment and interactions of living organisms. They identify abiotic and biotic factors and create a foldable and vocabulary cards. They create a poster illustrating soil and watch a video to study symbiosis.
Curated OER
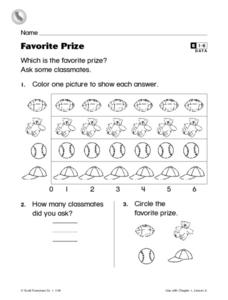
Favorite Prize
In this graphing worksheet, students focus on the usage of a pictograph. Students poll classmates and respond to 2 questions about the graph that they have created.
Curated OER
Jack-O-Lantern Glyph
Learners create a jack-o-lantern glyph that accurately represents his or her answers to a series of questions. The completed jack-o-lanterns are displayed in the classroom and the class interprets the data.
Curated OER
"The Science Times"
Students create their own newspaper after gathering information at the Museum of Natural History's Hall of Biodiversity.
Curated OER
Cartesian Baseball
Pupils are told what a coordinate system is and also that it provides a way of uniquely describing each point on a plane or in space. They are given a practice problem along with the equation. Students solve the following problem:...
Curated OER
Pizza Topping Combinations
Learners brainstorm pizza toppings and determine the number of possible ways to order a pizza. In this algebra lesson, students analyze and investigate geometric patterns as they relate to the concept of a variable. Learners then...
Curated OER
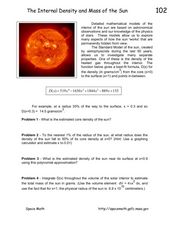
The Internal Density and Mass of the Sun
In this sun worksheet, students read about calculating the internal density and mass of the sun. Students use a given formula for the internal density of the sun's gases which students use to solve four mathematical problems.
Alabama Learning Exchange
The State Capital of Stem and Leaf
Students explore the concept of stem and leaf plots. In this stem and leaf plots lesson, students plot the 50 US states' capitals on a stem and leaf plot according to the first letter of each state. Students compare...
Curated OER
My Peanut Butter is Better Than Yours!
Learners explore the concept of statistical data. In this statistical data lesson, students read an article about the dangers of peanut butter to those who are allergic. Learners perform a taste test of two different brands of peanut...
Curated OER
Favorite Survey
Fourth graders collect and organize data for charts and bar graphs by questioning their classmates. They utilize a worksheet imbedded in this plan which guides them through their 'favorites' survey.
Curated OER
Checking County Numbers
Students use their county's information page to gather information about their community. Using the information, they create graphs from the tables provided and interpret the data. They write a paragraph showing their interpretation of...
Curated OER
The Great Chile Challenge
Fifth graders gather data, create a graph, and interpret information. They build vocabulary by negotiating the ideas that go into the graphs which they create. They use Excel to print a variety of graphs based on how much they like Chile...
Curated OER
Measuring the Speed of a Wave
Students create an experiment in which they measure the speed of a wave and record the data in a graph. They work in small groups to write the procedure for the experiment and share it with another group for cross checking of the...
Curated OER
Those Amazing Seaworld Animals
Students research the animals at SeaWorld and then relate the info they have found into various types of graphs; line, circle and bar. This lesson combines math and science nicely. They access a website imbedded in this plan to do their...
Curated OER
Phenomenal Weather-Related Statistics
Eighth graders research, collect and interpret data about weather statistics. They record that data on spreadsheets. they create Powerpoint presentations on their individual or group research.
Curated OER
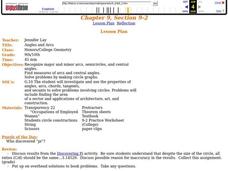
Angles and Arcs
Students discuss the sum of central angles and use string to create them on circles. They find the measure and length of both minor and major arcs.
Students give examples of concentric, similar, and congruent circles and congruent arcs.
Curated OER
What's Your Favorite Stuffed Animal?
Second graders gather information in a survey and interpret the results using a tally chart, a table, and a bar graph. They' present their results of the during the final group discussion. The subject of the survey is favorite stuffed...
Curated OER
The Stock Exchange Phase I
Second graders select a stock and follow its ups and downs, using graphs to show its success.
Curated OER
A Real Difference
Fifth graders use the Celsius and Fahrenheit thermometers to compare temperature readings. They use the Internet to find the temperatures of selected cities. After data is collected for five days, 5th graders graph the temperatures.
Curated OER
Remembering Our Veterans Data Management Project
Seventh graders utilize data collected from various sources based on Canadian military statistics to consolidate their understanding of data management. Students plan and create a PowerPoint presentation using this data including in...
Curated OER
Box Plots on the TI-83 Calculator
Eighth graders research box plots on the Internet. They gather real life statistics and analyze the collected statistics by making multiple box plots on the TI-83 calculator.


