Curated OER
The Dog Days of Data
Students are introduced to the organization of data This instructional activity is designed using stem and leaf plots. After gather data, they create a visual representation of their data through the use of a stem and leaf plot. ...
Curated OER
Birthdays
Students collect data about the birth months of each classmate using a calendar. They make a table with the information before designing a pictograph using cupcake images. They answer questions using the graph.
Curated OER
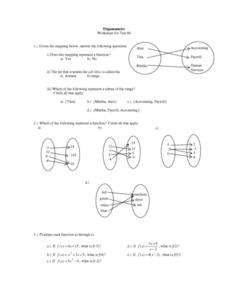
Trigonometry: Worksheet for Test #4
In this trigonometry worksheet, students determine whether given mappings are functions. They evaluate 5 functions for a given x value. Students graph 2 functions. They determine which ordered pairs are solutions to given functions....
Curated OER
Breakfast Cereal - How Nutritious Is Yours?
Students analyze the nutritional value of breakfast cereal in order to make an informed choice. They create a stem and leaf plot which analyzes the nutritional value of the cereal they eat on a regular basis. Students write a letter to...
Curated OER
Round and Round and Round We Go!
Pupils investigate motion using a CBL. For this algebra lesson, students collect and graph data on a coordinate plane. They define and identify amplitude and period of conic graphs.
Curated OER
Student Heights
Students measure the heights of their fellow classmates and create a box and whisker plot to display the data. In this measurement lesson plan, students analyze the data and record results.
Curated OER
Graphing Polar Coordinates
Students define polar equations and learn to plot them. In this calculus lesson, students relate polar equations to real life scenarios such as plants and comic strips. They discuss and define the curves of polar equations.
Curated OER
Math Centers
Fifth graders review the concepts of fractions: improper, mixed, proper, like denominator addition. They then review the concepts of creating pie graphs using a percent circle using manipulatives.
Curated OER
The Hot Dog Stand - An Annual Report
Learners run a computer simulation and collect data as they work and use the data to create an annual report for their business. It is desirable for students to do this project individually, but it could be done as a class using a large...
Curated OER
Hexagoning the Circle
Learners explore similarity to see that the area of a circle should be a constant times the square of its radius. Students create a hexagon. Learners share their designs with the class.
Curated OER
Graphing Grazy Crayons
Children create crazy crayons they made to sort and construct a floor bar graph. Then, using technology resources, they make a simple bar graph to compare the top four colors produced. Students will then interpret the printed graph by...
Curated OER
Discovering Pi
Students develop a formula that describes the functional relationship of the circumference of a circle to its diameter. Working with a partner, they measure the diameter and circumference of circular objects in order to discover the...
Curated OER
Sizing Pumpkins
Fifth graders study the sizes of pumpkins. They measure and record the diameters of pumpkins. They create five subtraction problems and solve them. They weigh their pumpkins, record the data and select two pumpkins to make a graph of...
Curated OER
Cruising the Internet
Students identify the parts of an engine using a graph. In this statistics lesson, students make a graph from their collected data. They calculate the volume of a cylinder using a line of regression and a scatter plot.
Curated OER
Aboriginal Statistics
Fourth graders analyze statistics of Native Americans by creating graphs. In this data analysis lesson, 4th graders define different statistical terms and practice finding those statistics from groups of numerical information about...
Curated OER
Toy Dissection Graph
Students explore simple machines and how they are made. They examine the parts of the simple machine and collect information about its parts. Using Excel, students create circle and bar graphs from the collected data.
Curated OER
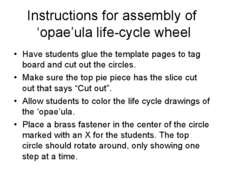
Instructions for Assembly of 'Opae" ula life-cycle wheel
Students study Opae ula. In this life cycle, art lesson, students color and cut out the printout of the life cycle of the Opae ula (red shrimp of Hawaii). They work independently to create the pie chart representing this life cycle. This...
Curated OER
Simplifying Fractions
For this math worksheet, students create fractions to represent the pie graphs and then perform the operations to simplify the ratios.
Curated OER
Finding Equations
Students make equations from everyday data. They create a graph from the equations. Students predict and analyze the results. Students complete the second scenario on their own and turn in their handout.
Curated OER
It’s Your Birthday! – Conventions: Revision and Proofreading
Happy birthday! Celebrate everyone's birthday with this writing activity, which prompts seventh graders to research historical events in a country at the time of their birth to create an essay. Working in pairs, they proofread each...
Curated OER
Lady Macbeth's Cure
High schoolers role-play the position of Lady Macbeth's nurse. They are to create a project or service that can cure her sleepwalking. They create their own commerical to sell their product.
Curated OER
Exploring Fractions
Students participate in a web scavenger hunt to find the answers to develop an understanding of fractions. They complete a geometric graph with shapes representing fractions.
Alabama Learning Exchange
Ellipse
Students explore the concept of ellipses. In this ellipses lesson, they construct ellipses on their paper and follow directions on a worksheet that allow them to investigate an ellipse in more depth by looking at the major axis, foci, etc.
Curated OER
Pi Digit Distribution
Students study graphing skills and compare and contrast data sets. They compute pi through the first 50-100 digits and create a bar graph showing the frequencies of specific digits.


