Hi, what do you want to do?
Curated OER
Finding the Salt Front
Learners discuss definitions of estuary, salinity, and the salt front. They listen as the teacher explains the Hudson River Miles and ways the upriver and downriver sections relate to the north and south. Students graph the salt front...
Curated OER
Lift Equation Problem Set
Students, after reading an explanation from a NASA Web-based textbook, demonstrate an understanding of the text by using it, along with FoilSim, to complete an activity to graph and interpret the lift equation.
Curated OER
Space: The Final Frontier
Sixth graders construct a graph to demonstration information that they've learned about the solary system. They also write or illustrate a sonar or lunar eclipse.
Curated OER
Hectic Hurricanes!
Students determine what they know about hurricane formation. They experiment to explain hurricane formation and track a hurricane that forms in the Caribbean Islands.
Curated OER
Express Yourself!
Fifth graders study different types of poetry, compose a poem and word process it.
Curated OER
Bears
Students complete a variety of bear-related activities. They sort and graph teddy bears, distinguish between real and non-real bears and research bear life cycles and habitats.
Curated OER
How to Keep a Scientific Journal
High schoolers record observations of a living organism over a period of time. They observe meal worms and record their observations in a scientific journal.
Curated OER
Adding Flags and States to you State Report
Third graders word process, edit text and add images from the Internet to a document. They explore copyright, fair use, how to evaluate web sites and citing sources.
Curated OER
Career Exploration
Fifth graders identify areas of careers that coincide with their individual interests.
Curated OER
Exercising the Franchise! The Right to Vote
Students research Canadian election procedures, identify candidates and corresponding political platforms for current elections and hold mock elections. They develop a written report about a specific political party.
Curated OER
Cubic Volume
Fifth graders record measurements and calculate the volume. They select and use appropriate units and procedures to measure volume # use tools such as technology to solve problems
Curated OER
Fun With Graphs
First graders read about making graphs and lean how to make graphs using "The Graph Club" software.
Curated OER
The Diary of Anne Frank: Research Project on Concentration Camps during World War II
Eighth graders investigate the Holocaust and the persecution of specific ethnic groups in Europe during World War II.
Curated OER
Study of an Artist
Fourth graders research an artist, write a short report and do an oral presentation.
Curated OER
Lewis and Clark Encounters with Native Americans
Students research what the exchange was between the various Native American groups and Lewis and Clark. They are able to write reflections after truly considering the issue with the help of research.
Curated OER
Saving An Endangered Species
Second graders work in groups in order to look at specific internet sites for animal adoption and sponsorship. They select an endangered species, determine needed funds, develop, advertise, and carry out a fund-raising plan.
Curated OER
Polluted Soil
Pupils take plants of their own choice and pollute the soil with a pollutant of their own choice or one assigned by the teacher. They regularly record observations such as plant growth, health, and soil pH.
Curated OER
Metal Composition & the U.S. Mint
Students study the meaning, symbolism, and value of U.S. coins,
especially the quarter. Theyresearch why in 1965 the U.S. Mint decided to
change the metal composition of the quarter to copper coated with nickel.
In addition, they perform...
Curated OER
Grow Your Own Grub
Young scholars study plant needs and growth by completing a gardening activity. In this plant study lesson, students watch a video and discuss plant growth needs. Young scholars plant seeds in containers and water the plants. Students...
Curated OER
Dino Hunt
Students use the Internet to gather information about dinosaurs. They practice navagating through the different websites. They also practice listening to directions and also explore how to fill out a KWL chart.
Center for Innovation in Engineering and Science Education, Stevens Institute of Technology
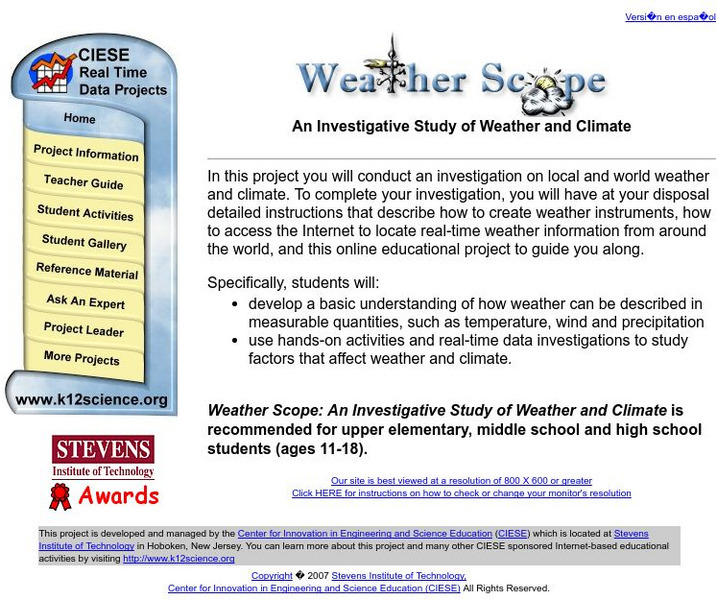
Ciese Real Time Data Projects: Weather Scope: A Study of Weather and Climate
Use real-time data to study factors that affect weather and climate, create weather instruments, and share data with students around the world.
Science Education Resource Center at Carleton College
Serc: Mn Step: Statistical Analysis of Lincoln
For this activity, students first work in groups to collect information about a set of pennies. They measure and record the mass for each one in a table using a spreadsheet program if possible. They also record its year and, for 1982...
University of Texas
Inside Mathematics: Parking Cars [Pdf]
This task challenges a student to use their understanding of scale to read and interpret data in a bar graph.
Google
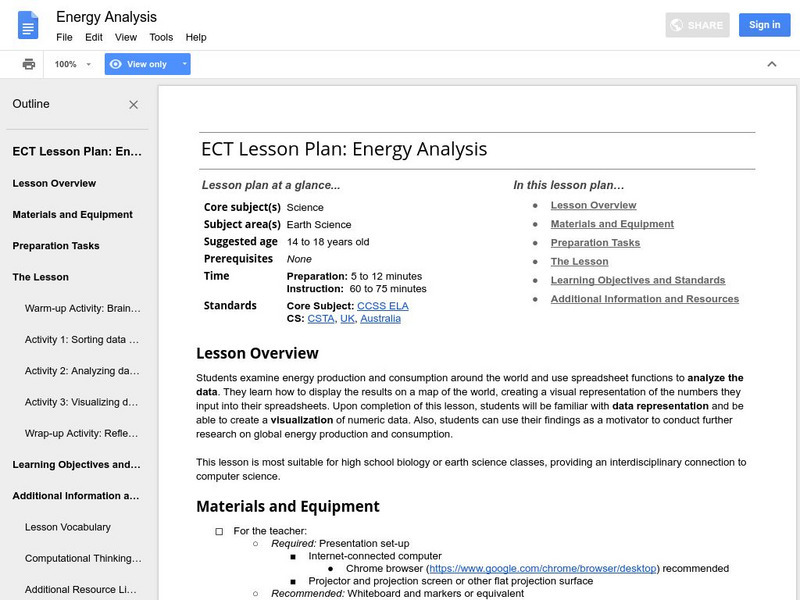
Google for Education: Energy Analysis
Students collect data on energy production and consumption around the world. They input the data into a spreadsheet and use spreadsheet functions to analyze it. Finally, they upload the data into a fusion table to create a visualization.


![Inside Mathematics: Parking Cars [Pdf] Lesson Plan Inside Mathematics: Parking Cars [Pdf] Lesson Plan](https://static.lp.lexp.cloud/images/attachment_defaults/resource/large/FPO-knovation.png)
