Curated OER
Our Favorite Pet
Students each have a turn, telling the class his or her favorite pet. The choices are cat, dog, fish or bird. Using the computer, the information from the tally be recorded on a spreadsheet and bar graph.
Curated OER
The Stock Exchange Phase I
Second graders select a stock and follow its ups and downs, using graphs to show its success.
Curated OER
Weather Or Not
Students use the internet to find pen pals to share in their weather experiment. Individually, they research the high and low temperatures for cities within the United States and email the results to their pen pal. They also develop a...
Alabama Learning Exchange
Explore the Transformations of Linear and Absolute Value Functions Using Graphing Utilities
Students explore the concept of transformations. For this transformation lesson, students use an applet that is an interactive absolute value graph applet. Students manipulate the applet to examine the change in the function and how it...
Curated OER
Olympic records through time
Students compare the records of gold medal Olympic winners for the last 100 years and decide if we are faster, stronger than in the past.
Curated OER
Home on the Biome
Fifth graders study six major biomes, graph temperature and rainfall, and present their findings to the class.
Curated OER
Inching Our Way Into The Metric System
Students investigate the Metric System. They discuss the history of the Metric System, convert various units of measurement into the Metric System, and solve problems on a spreadsheet.
Curated OER
Missed The Boat
Students complete time and distance problems. Using appropriate problem solving strategies, students determine when a helicopter will catch a cruise ship. Students write a summary of their solution process. They complete a graph to...
Curated OER
A Teeny Tiny Book: My Friends
In this mini book worksheet, students cut apart and complete a teeny tiny book with names of friends and their phone numbers.
Curated OER
What's Your Favorite Stuffed Animal?
Second graders gather information in a survey and interpret the results using a tally chart, a table, and a bar graph. They' present their results of the during the final group discussion. The subject of the survey is favorite stuffed...
Curated OER
Exploring Area
Fifth graders explore the concept of area using the geometry of selected objects. The laboratory for this experience is the classroom. The instructional activity focuses upon the objects that have four sides like squares and rectangles.
Curated OER
Ratios Through Social Studies
High schoolers analyze and integrate mathematical concepts within the context of social studies. They gather, present and analyze information on a bar graph, pie chart, etc. Students compute ratios. They demonstrate that ratios have...
Curated OER
Fun With Graphs
First graders read about making graphs and lean how to make graphs using "The Graph Club" software.
Curated OER
Fairytale Favorites
Students access George MacDonald's Fairytales website, read exerpts of pre-selected tales, select their favorite and communicate that information via the internet to another class.
Curated OER
Building Paper Bridges
Young scholars construct a bridge that can hold 100 pennies. For this math lesson, students evaluate the strength of their bridges. They predict how much weight a bridge can hold based on its design.
Curated OER
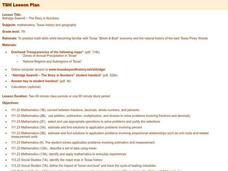
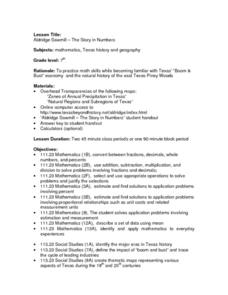
Aldridge Sawmill - The Story in Numbers
Seventh graders practice math skills while becoming familiar with Texas' "Boom & Bust" economy and the natural history of the east Texas Piney Woods. They utilize worksheets and websites imbedded in this plan.
Curated OER
Aldridge Sawmill - The Story in Numbers
Seventh graders view overhead maps of Texas, explore history of Aldrige Sawmill, and practice math skills while becoming familiar with Texas' "Boom & Bust" economy and natural history of east Texas Piney Woods.
Curated OER
Aldridge Sawmill -- The Story in Numbers
Seventh graders view a recent transparency of the average rainfall zones of the state of Texas. Using another transparency, they identify the Piney Woods subregion of the Gulf Coastal Plain and locate national forests and sawmills. ...
Curated OER
Function Machine
Second graders decipher a pattern using input and output. In this functions lesson, 2nd graders use input and output numbers to find a pattern involving addition and subtraction. Students use the pattern they discovered to help solve...


