Scholastic
Scholastic: Bars, Lines, and Pies
Middle schoolers will learn and reinforce skills for creating, applying and analyzing pie charts, bar graphs and line graphs.
Better Lesson
Better Lesson: Building Our Own Bar Graphs (Part I)
Second graders use data to create a tally chart and make a bar graph. This lesson includes a detailed plan, videos of students engaged in the lesson, and printable worksheets.
TeachEngineering
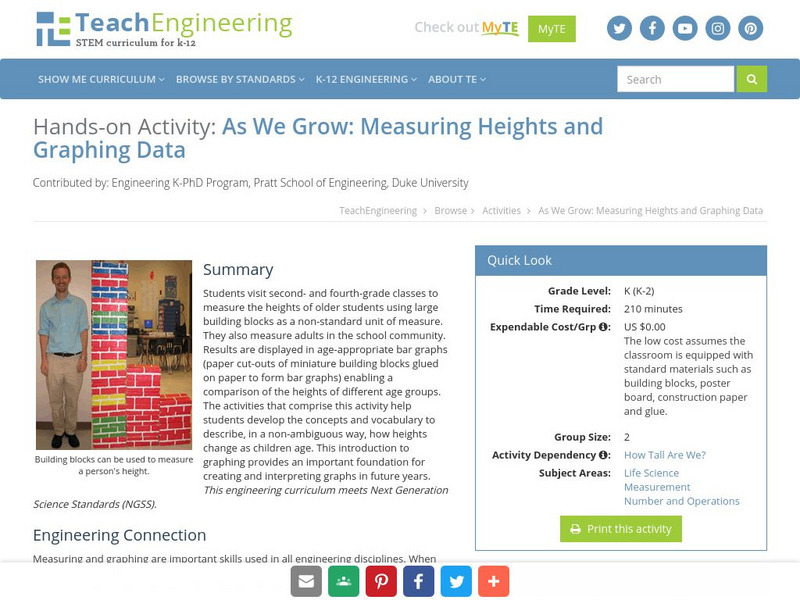
Teach Engineering: Growing and Graphing
Students visit a 2nd and a 4th grade class to measure the heights of older students using large building blocks as a non-standard unit of measure. They can also measure adults in the school community. Results are displayed in...
The Franklin Institute
Frankin Institute Online: Group Graphing
This site from The Franklin Institute explores how to make a simple graph using a spreadsheet to portray survey data. It also gives a set of interesting sports-related web sites so that students can get statistical inforamtion.
Better Lesson
Better Lesson: Class Surveys and Graphs
Learners love graphing data that they "own". In this plan, the class will select a type of graph and create it using a class survey frequency table. Included in this activity are videos of the class engaged in the activity and samples of...
TeachEngineering
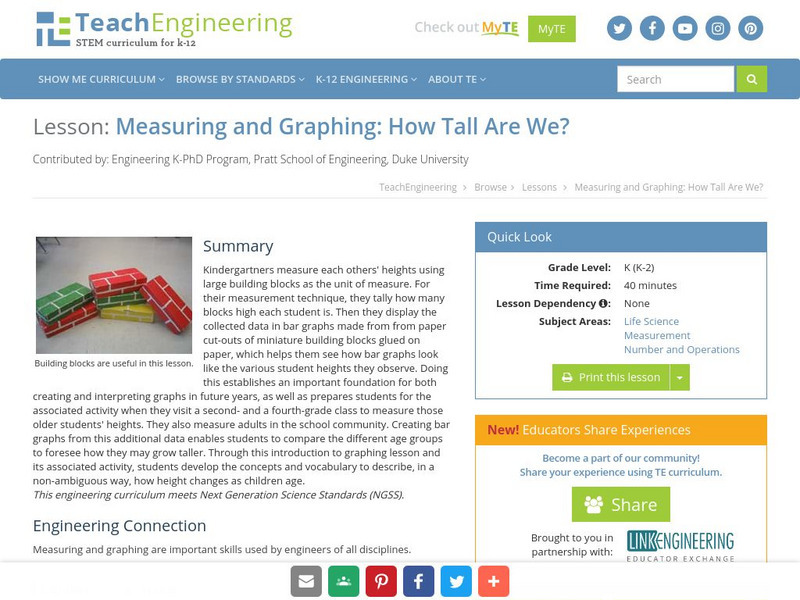
Teach Engineering: How Tall Are We?
Kindergartners measure each other's height using large building blocks, then visit a 2nd and a 4th grade class to measure those students. They can also measure adults in the school community. Results are displayed in age-appropriate bar...
Alabama Learning Exchange
Alex: M&m's and Blogs: Interpreting Data!
In this hands-on, technology-rich lesson plan, students will interpret data. The students will define words involving graphs, create a bar graph using M&M's, and post information from their findings on the internet. The students will...
Council for Economic Education
Econ Ed Link: Who Is Working?
This activity teaches students what economists mean when they talk about people who are employed, unemployed, and not in the labor force. It discusses the Current Population Survey and asks students to pose as government survey workers...


