Curated OER
Areology-The Study of Mars
Students examine core samples from Mars and discover what they can use it to tell the history of Mars. In this core sample lesson students create and analyze their own core samples then eat them at the end.
Curated OER
Inequalitities Mixed Review
Students solve inequalities and graph it on a number line. In this algebra lesson plan, students rewrite word problems into algebraic equations and graph it using compound inequalities.
Curated OER
Surveying the Land
Students explore the different kinds of maps and the purpose of each. In this Geography lesson, students work in small groups to create a map which includes the use of a map key.
Curated OER
Technobiz
Students examine candy preferences to create a plan in order to improve candy sales. In this technobiz lesson, students build spreadsheet and organizational skills by graphing and calculating data. Students are introduced to terminology...
Curated OER
Front Page News
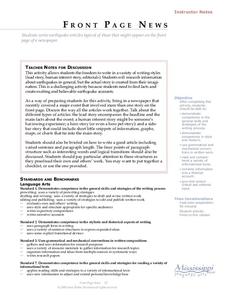
Students write original earthquake articles typically found on the front page of a newspaper. Each student has the freedom to write in a variety of writing styles (lead story, human interest story, editorials, etc.). They research...
Curated OER
Understanding Absolute Values
Students solve absolute value problems, In this algebra lesson, students discuss distance as they relate it to absolute values. They distinguish between negative and positive numbers inside of an absolute value bars and how the answer...
Curated OER
Math Spinner Game
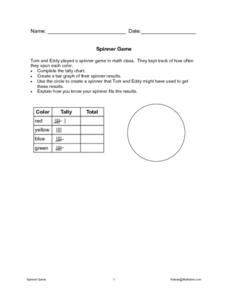
In this math game worksheet, students complete a tally chart by filling in the "total" column of a graphic organizer. Students then create a spinner that might have been used to get the results shown and then explain how they know the...
Curated OER
What are Fractals?
Middle and high schoolers identify and analyze fractals and research information using the Internet to locate information about them. They look at fractals in relation to nature and other real world situations. Pupils create several...
Curated OER
Following Directions
Learners explore the way astronauts practice and train to improve their efficiency in completing challenging tasks. They time and graph how long it takes to follow a list of directions. Also, they determine how practice and repetition...
Curated OER
Statistics: Misleading or Accurate?
Learners explore the concept of misleading statistics. In this misleading statistics lesson, students play a game of tag and graph the number of times each student gets tagged. Learners use the graph to determine the fastest runner in...
Curated OER
Campaign 2000
Students research newspapers and the Internet to learn about the election. Students work in groups and choose a state that they want to compare to Florida. Students organize the data they have found into a graph labeling an "x" and "y"...
Curated OER
Baseball - America's Pastime
Students complete Internet research about baseball and baseball players. They complete a variety of activities including writing an epitaph for Jackie Robinson, a news article about him, and make graphs displaying salaries of a number of...
Curated OER
In the Right Mode
Sixth graders practice determining mean, median, mode, and range using individual mileage logs. They convert miles to kilometers and graph their results.
Curated OER
What's a Per-"cent"?
Students recognize the mathematical connections between fractions and percents. They develop and study graphs to make connections between their data and what it represents. They write about the connections they have discovered.
Curated OER
If .... Then Probably
Students are introduced to the concepts of probability and chance. Using data given to them, they organize and create a chart to display the information. Using this chart, they calculate the percentage of chance and probability and...
Curated OER
Basketball And Mathematics
Eighth graders collect and analyze data about foul shots taken at basketball games.
Curated OER
How Are Students Doing on the AP exams?
Students compile and analyze data pertaining to College Credit AP Exams. They pose questions - Which exam is the easiest? - determine answers from their data and display their results.
Curated OER
Graphing the Past Using Today's Technology
Eighth graders research and gather information from such sources as Microsoft Encarta, World Wide Web sites, and other sources using computer software to collect data.
PHET
Soda Bottle Magnetometer
Introduce learners to set of complete instructions that describe how to build a magnetometer that works just like the ones professional photographers use to predict auroras. The diagrams are wonderfully descriptive, and the written...
Curated OER
Jelly Belly: What a Wonderful "Bean"!
Students explore how jelly beans are produced. They discuss the origins of the jelly bean and view a video about how jelly beans are prepared, tested, shaped, finished, and shipped and estimate the amount of jelly beans in a jar and sort...
Curated OER
Can you Find the Expression
Students collect data from measurements and weights for this experiment. In this algebra lesson plan, students analyze graphs they create form their data to find the expression representing the data. They label which graph provided the...
Curated OER
Favorite Farm Animals
Students perform a study of farm animals and their babies. They compile a graph of their favorite farm animals. They utilize a spreadsheet worksheet which is imbedded in this plan.
Curated OER
Population Pyramids
Students create a population pyramid based on current data for their final project country. They analyze data from comprehension trends of final project country. Students analyze populations of specific countries.
Curated OER
Grade 2: Spinning Sums
Second graders collect data by spinning two spinners and creating sums, organize the data, and make conclusions from the data. Each students makes a spinner. They spin and record the number of the section each time. Students work in...


