Curated OER
Growing Tomatoes
Second graders investigate the growth of tomatoes. They plant grape tomatoes and observe them. They write in a journal and take digital pictures of their tomato plants. They create bar graphs to tally the progress of their plants and...
Curated OER
Ratios Through Social Studies
Pupils analyze and integrate mathematical concepts within the context of social studies. They gather, present and analyze information on a bar graph, pie chart, etc. Students compute ratios. They demonstrate that ratios have real-world...
Curated OER
Make a Dinosaur
Students estimate the size of dinosaurs and create a dinosaur model. They create bar graphs of the sizes of dinosaurs one in meters and the other in "student" units. They draw a pictures and add words or sentences about their dinosaur.
Curated OER
What's The Teacher's Choice?
Fifth graders explore how to use data and display it using a chart or graph. They use food choices for categories and then gather the data and use the provided chart for display. In small groups students discuss the data and the results.
Curated OER
Wet Weather, Wet Climate
Students discover the differences between weather and climate in this long-term lesson introduction. They create rain gauges and practice reading rainfall measurements, view a website showing the cloud cover in their location and draw...
Alabama Learning Exchange
Poppin' For Popcorn!
Students graph data from different popcorn flavors. In this graphing lesson, students make graphs using an assigned web site after collecting data about the flavors of popcorn that fellow classmates prefer.
Curated OER
Recording Frequency
First graders analyze nursery rhymes and gather data about word frequency. For this frequency lesson, 1st graders create graphs and tables. Students interpret the data.
Curated OER
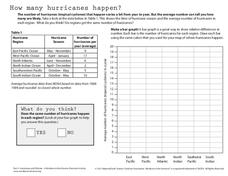
How Many Hurricanes Happen?
In this hurricanes activity, students use a data table showing the hurricane region and the average number of hurricanes per year to determine if the same number of hurricanes happen in each region by creating a graph. Then students...
Curated OER
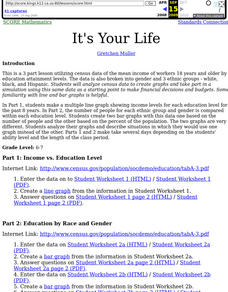
It's Your Life
Students make a multiple line graph showing income levels for each education level for the past 8 years and the number of people for each ethnic group and gender is compared within each education level.
Curated OER
Time Changes Everything
Students analyze census data from 1915, 1967 and 2006. They read an article about how the world's population is growing at an alarming rate. They use primary source documents to create a timeline on the information they gathered. They...
Curated OER
Jack and the Beanstalk Math
Students listen to Jack and the Beanstalk and determine what they think are the most common words. In this Jack and the Beanstalk lesson plan, students reread the story, count the words they chosen and graph those words. Students...
Curated OER
Conduction, Convection, Radiation, Oh My!
Middle schoolers draw a line graph, and use graphing as a tool to discover more about conduction, convection and radiation. They should design their own experiment using heat sensitive paper to show they explain these 3 processes.
Curated OER
Good Health Care
Young scholars work in collaborative groups researching topics such as nutrition, the benefits of exercise on the body, dental and personal hygiene. They conduct interviews, create charts and posters, and report their results with a...
Curated OER
Black History Project
Third graders explore and analyze about famous African-Americans by listening to four picture book biographies. They generate a list of 15 famous African-Americans and then create a survey to rank them according to importance of...
Curated OER
Crime Watch
Young scholars analyze the recent rise of homicides in some American cities, create and share posters, and write reflective essays in the form of letters to community leaders.
Curated OER
The Foods we Eat (Los Alimentos)
Sixth graders sing a song and create flashcards showing their favorite foods. In this Spanish "What do you like? lesson, 6th graders display Spanish foods using a document camera and graph their favorites.
Curated OER
Yummy Apples!
Students discuss apples and how they are grown. They listen as the teacher reads "Apples," by Gail Gibbons. Students discuss the story. They view several different types of apples and compare their characteristics. Students taste several...
Curated OER
When Dinosaurs Ruled the World
Students graph the varying sizes of dinosaurs. In this math and dinosaur lesson, students view dinosaur models and compare the different shapes and sizes of the dinosaurs. Students complete a dinosaur math activity, read The...
Curated OER
Energy Efficient Buildings
Seventh graders create plans for an energy efficient addition to the school. They work in small groups with each group having responsibility for examining one aspect of the problem. They create working diagrams and a model of their...
Curated OER
December Celebrations
Students study customs of various winter holidays. In this holiday lesson, students read the book The Reasons for the Seasons and complete a winter glyph. Students use graphing software to create a chart of the holidays that are celebrated.
Curated OER
Probabilities for Number Cubes
Students explore the concept of probability. In this probability lesson, students roll a six-sided number cube and record the frequency of each outcome. Students graph their data using a frequency chart and keep tally marks...
Curated OER
T-Shirt Lettering
Students determine the cost of a t-shirt using a variety of mathematical operations to solve problems. Then they use a spreadsheet to calculate the cost of lettering a t-shirt and display this information in a graph.
Curated OER
Solar Power
Fifth graders create their own solar panel. They use this experiment to see how the sun can be used as a form of energy.
Curated OER
Where the Buffalo Roam
Students lear about energy, energy efficiency and consumption. They measure energy use, graph the date, write a letter then design and present a PowerPoint on the topic.


