Curated OER
Linear Systems: Least Squares Approximations
In this least squares approximation activity, students determine the number of solutions a given linear system has. They find the least square error and the equation of a line of best fit for a set of three points. Students find the...
Curated OER
Prairie Math
Students work together to build models of prairie plants. Using the model, they estimate the height and then measure them using metric and standard units. They write a fraction to represent their part of the whole set and compare and...
Curated OER
Line of Best Fit
In this line of best fit worksheet, students solve and complete 8 different problems that include plotting and creating their own lines of best fit on a graph. First, they study the samples at the top and plot the ordered pairs given on...
Curated OER
What's Your Hypothesis?
Find the article, "In the Thick of Air Pollution," not through the resource link in the lesson, but through an Internet search. Have high schoolers read it and perform calculations with the statistics provided. The objective is to...
Curated OER
Completing University
Learners analyze the pros and cons of completing a 4 year school. In this statistics lesson, students complete surveys and use E-STAT to graph their data. They learn to plot and build diagrams.
Curated OER
M&M Exponential Activity
Students create a scatter plot of their experimental data. In this algebra lesson, students use M&M's to determine an algebraic model. They discuss results in class.
Curated OER
You Gotta Have Heart
Ninth graders investigate the concept of relations and interpret graphs and tables. They analyze given data and look for a pattern to determine if the numbers represent a function. Students practice solving scientific word problems that...
Curated OER
Pet Count Excel Graphing
Students used collected data to distinguish what pets they have or would like to have. They correlate findings with appropriate technology--Excel. At the end of the lesson they tabulate a bar chart and present their findings to the class.
Curated OER
How To Make Yeast Cells Thrive
Students set up and run the experiments they designed in the instructional activity, 'Population Growth in Yeasts,' using simple yeast-molasses cultures in test tubes. They demonstrate understanding that several environmental factors can...
Curated OER
Math Mission
Second graders investigate the concept of Puerto Rican animals through using math word problems. They create a story to correlate with the word problems. The lesson also uses data of species counts to show increases and decreases for...
Curated OER
Graphin' And Glyphin' Utah Weather
Fourth graders investigate the concepts of looking at sets of data. The focus of the study is upon the local weather of Utah. They study the weather found in the city and in the country and make comparisons based upon geographical location.
Curated OER
Line Best Fit
Young scholars identify the line of best fit. In this statistics lesson, students analyze graphs and plots to identify positive, negative or no correlation. They find the line of best fit for different scatter plots.
Teach Engineering
About Accuracy and Approximation
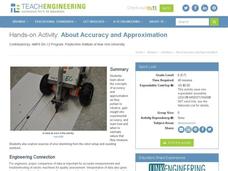
How accurate are robots? Groups draw lines by moving robots backwards and forwards by one rotation of the wheels. Using the appropriate formula, they determine the percent error in the length of the lines in relation to the calculated...
Curated OER
World's Strongest Manduca
Students test the strength and speed of their Manduca. They keep their insect in a small dish and wiegh it down with pennies. They share their observations with the class.
Curated OER
A Statistical Look at Jewish History
Students complete their examination over the Jewish Diaspora. Using population figures, they discover the importance of percentages in exploring trends. They use their own ethnic group and determine how it is represented in the United...
Curated OER
Reservoir Activity
Students research the economic importance of the major reservoirs in Illinois. In groups, they manage a budget for one of the lakes to promote tourism in the area. They also work together to create advertisements.


