Curated OER
Maximum and Minimum Points
In this maximum and minimum points worksheet, students solve and complete 12 various types of problems. First, they find the area of the smallest triangle given the point of intersection. Then, students find the volume of a box that has...
Curated OER
Parametrics 1
In this parametric worksheet, students sketch given inequalities and use trigonometry functions to eliminate the parameters. They write equations of a line under given parameters. This four-page worksheet contains 11 multi-step problems.
Curated OER
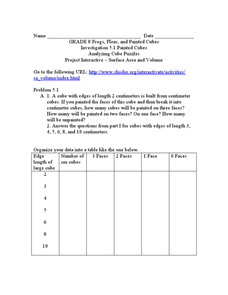
Analyzing Cubes
In this analyzing cubes worksheet, 9th graders solve and complete 6 different types of problems. First, they organize the given data into the table provided. Then, students study the patterns in the table and tell whether the pattern of...
Curated OER
Quadrants
For this quadrants worksheet, 10th graders solve and graph 6 different graphs that contain four different quadrants. They name the quadrant or on which axis the point lies. Students identify the difference between graphing positive and...
Curated OER
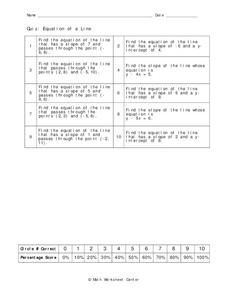
Equation of a Line
In this equation of a line activity, 9th graders solve 10 different problems that include the equation of a line. First, they determine the equation of a line that has a given slope and passes through a given point on a graph. Then,...
Curated OER
Direct Variation
In this direct variation worksheet, students complete 9 multiple choice problems regarding direct variation. Students determine direct variation equations from word problems and from graphs.
Curated OER
The Distance Formula
In this distance formula worksheet, students solve and complete 28 various types of problems. First, they find the distance between each pair of points provided. Then, students solve and graph the points.
Curated OER
Reflections (2)
In this graphing worksheet, students focus on reflections. Students use rotations to create 6 geometric figures that are represented on the x or y axis.
Curated OER
Grids
In this geometry worksheet, students plot and label 8 sets of points and triangles on a grid using coordinate pairs. They use both positive and negative numbers.
Center of Excellence for Science and Mathematics Education
A Sick Astronaut
Aspiring astronauts graph, interpret, and analyze data. They investigate the relationship between two variables in a problem situation. Using both graphic and symbolic representations they will grasp the concept of line of best fit to...
Curated OER
Worksheet 1, Basic Calculus Pre-Course Review
In this calculus worksheet, students review topics they need to already understand in order to be successful in a basic calculus course. Topics include functions, linear equations, coordinate graphing, piece-wise formulation, exponents,...
Curated OER
Linear Equations and Their Graphs
In this Algebra I/Algebra II worksheet, students solve problems involving interpreting the slope of a linear equation as a rate of change. The two page worksheet contains a combination of seven multiple choice and free response...
Curated OER
Coordinate Geometry
In this geometry learning exercise, students calculate the midpoint and distance between two points. They use the correct formula to solve the area and perimeter of polygons. There are 20 multiple choice questions with an answer key.
Inside Mathematics
Functions
A function is like a machine that has an input and an output. Challenge scholars to look at the eight given points and determine the two functions that would fit four of the points each — one is linear and the other non-linear. The...
West Contra Costa Unified School District
Sneaking Up on Slope
Pupils determine the pattern in collinear points in order to determine the next point in a sequence. Using the definition of slope, they practice using the slope formula, and finish the activity with three different ways to...
EngageNY
Finding Systems of Inequalities That Describe Triangular and Rectangular Regions
How do you build a polygon from an inequality? An engaging lesson challenges pupils to do just that. Building from the previous lesson in this series, learners write systems of inequalities to model rectangles, triangles, and even...
West Contra Costa Unified School District
Matching Quadratic Functions
Ever sigh when learners ask why they have to know so many different forms of the quadratic equation? Here is a lesson that comes in handy! Using hands-on matching activities, quadratic equations are explored through...
Balanced Assessment
Catenary
Develop a model for a hanging chain. Pupils find a mathematical model for a hanging chain and then they compare their models to the precise function that models the curve. Scholars come up with a strategy to determine how close...
Balanced Assessment
Para-Ball-A
Analyze the flight of a thrown ball. Learners determine the maximum height of a thrown ball and the time it takes to hit the ground given its initial speed. They continue to review different scenarios with different maximums or...
EngageNY
The Computation of the Slope of a Non-Vertical Line
Determine the slope when the unit rate is difficult to see. The 17th part of a 33-part series presents a situation that calls for a method to calculate the slope for any two points. It provides examples when the slope is hard to...
Mathematics Assessment Project
Sugar Prices
Sugar rush! In this assessment task, learners interpret points on a scatter plot representing price versus weight for bags of sugar. They then determine the bag that represents the best value.
EngageNY
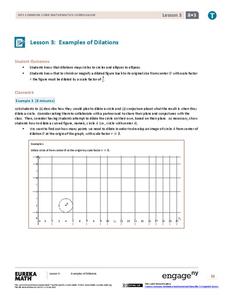
Examples of Dilations
Does it matter how many points to dilate? The resource presents problems of dilating curved figures. Class members find out that not only do they need to dilate several points but the points need to be distributed about the entire curve...
Curated OER
MT-A141 PreCalculus: Worksheet 6.2/6.3
In this precalculus worksheet, students use their graphing calculator to determine the coordinates for given functions. They determine the values for cosine, sign, tangent, and secant of given equations. Given an angle of elevation,...
Curated OER
Worksheet 2.4/2.5: MT-A141 PreCalculus
In this precalculus worksheet, students use their graphing calculator to graph the domain and range of given terms. They write parametric equations and identify the coordinates of the points on the relation given certain terms.
Other popular searches
- Coordinate Graphing Pictures
- Holiday Coordinate Graphing
- Graphing Coordinate Planes
- Coordinate Graphing Worksheets
- Cartesian Graphing Pictures
- Coordinate Graphing Art
- Using Coordinate Graphing
- Coordinate Graphing Practice
- Algebra Coordinate Graphing
- Coordinate Graphing Distance
- Graphing Coordinate Pairs
- Graphing on a Coordinate Grid


