Curated OER
AP Calculus Practice Exam: BC Version - Part A
In this calculus worksheet, students solve 28 multiple choice problems. Students find derivatives, volumes, limits, convergent series, etc.
Curated OER
1st Geometry
In this geometry worksheet, students choose the multiple choice answer to 15 questions involving several different elements of geometry.
Curated OER
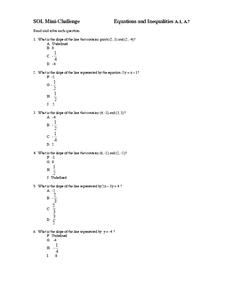
Equations and Inequalities
In this equations and inequalities worksheet, 9th graders solve and graph 10 different problems that include determining the slope of a line in each. First, they determine the line that contains given points on a grid. Then, students...
Curated OER
Slope
In this slope activity, 9th graders solve and complete 18 different problems that include identifying various points on a graph. First, they determine the slope of each line drawn on the grid to the right. Then, students determine the...
Curated OER
Plotting Coordinates
In this geometry skills worksheet, students plot the listed coordinates on the provided graphs in order to identify the appropriate shapes.
Curated OER
Ordered Pairs and Linear Systems
In this ordered pair and linear systems worksheet, students problem solve two equations involving ordered pairs and solving linear systems by graphing.
Curated OER
Plotting Coordinates #2
In this plotting coordinates learning exercise, students plot sets of coordinates on graphs, then name the shape the plots formed. A reference web site is given for additional activities.
Virginia Department of Education
Transformations
Geometry in life-sized dimensions! Using enlarged graph paper, pupils perform a series of transformations. By recording the initial and final placement of the images, they are able to analyze the patterns in the coordinates during a...
Virginia Department of Education
Inequalities
Compare graphing an inequality in one variable on a number line to graphing an inequality in two variables on a coordinate plane. Young mathematicians work on a puzzle matching inequalities and their solutions. They then complete a...
Illustrative Mathematics
Walk-a-thon 1
Your mathematician's job is to explore the relationship between hours and miles walked during a walk-a-thon. The activity compels your learners to experiment with different means in finding out this proportional relationship. The answer...
Curated OER
Translation of Shapes
Geometers graph figure translations, find coordinates for transformed figures, and write rules to describe transformations presented. The 2-page worksheet contains 14 problems, with answer key attached.
Illustrative Mathematics
Walk-a-thon 2
During a walk-a-thon your learners must determine the walking rate of Julianna's progress. Using tables, graphs, and an equation, they must be able to calculate the time it took her to walk one mile and predict her distance based on the...
Geophysical Institute
Latitude and Longitude with Google Earth
Travel the world from the comfort of your classroom with a lesson that features Google Earth. High schoolers follow a series of steps to locate places all over the earth with sets of coordinates. Additionally, they measure the distance...
Illustrative Mathematics
Influenza epidemic
This activity presents a real-world problem about an epidemic of influenza spreading through a city. Learners refer to a graph that shows the number of individuals infected in relation to the number of weeks that have elapsed since...
Illustrative Mathematics
Coffee by the Pound
This is a great exercise in graphing proportional quantities to interpret the unit rate as the slope of a graph. It is not easy for learners to understand what a unit rate is. When it is presented as the slope of a linear line graph,...
EngageNY
Analyzing Residuals (Part 1)
Just how far off is the least squares line? Using a graphing calculator, individuals or pairs create residual plots in order to determine how well a best fit line models data. Three examples walk through the calculator procedure of...
Illustrative Mathematics
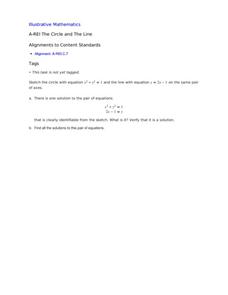
The Circle and The Line
Here is a resource where algebra learners show their understanding of a system of equations involving a circle and a line. Once graphed, learners see two points of intersection, one where the ordered pair is read, and a second where...
Illustrative Mathematics
Find the Change
This exercise is an opportunity for algebra learners to understand the connection between the slope of a line and points found on the line. Use similar triangles to explain why slope m is the same between any two points. Discuss with the...
Illustrative Mathematics
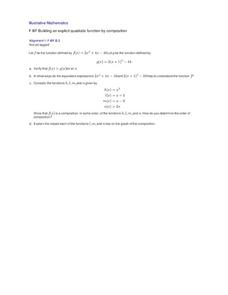
Building an Explicit Quadratic Function by Composition
Use an activity to illustrate the different forms of a quadratic function. Here, the task asks learners to use composition of given functions to build an explicit function. The process emphasizes the impact of the order of...
EngageNY
Matrix Notation Encompasses New Transformations!
Class members make a real connection to matrices in the 25th part of a series of 32 by looking at the identity matrix and making the connection to the multiplicative identity in the real numbers. Pupils explore different...
SHS Algebra
Linear vs. Exponential Functions Tasks
Your algebra learners will enjoy the real-life application of the three tasks presented here. They complete a table and a graph comparing the two options presented. One option is linear, while the other is exponential. After coming up...
Concord Consortium
Writing and Sketching I
Writing and sketching functions—what more could you want to do? Learners write and sketch functions that meet certain conditions as they complete a short task. They find a parabola that encompasses three quadrants of the coordinate plane...
Curated OER
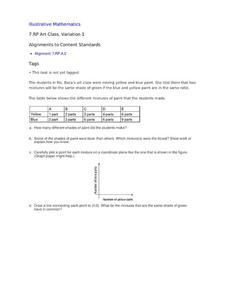
Art Class, Variation 1
Student statisticians calculate ratios to determine how many shades of green were mixed by Ms. Baca's art class. They graph the number of blue parts against the number of yellow parts for each combination and discover that some produce...
CCSS Math Activities
Social Security Trust Fund
Will Social Security still be around when you retire? Given data on the predicted balance of the social security fund over time, scholars plot the points on a coordinate grid and determine if a quadratic regression fits the data. They...
Other popular searches
- Coordinate Graphing Pictures
- Holiday Coordinate Graphing
- Graphing Coordinate Planes
- Coordinate Graphing Worksheets
- Cartesian Graphing Pictures
- Coordinate Graphing Art
- Using Coordinate Graphing
- Coordinate Graphing Practice
- Algebra Coordinate Graphing
- Coordinate Graphing Distance
- Graphing Coordinate Pairs
- Graphing on a Coordinate Grid


