Practical Money Skills
Practical Money Skills: Prom Spending Survey Infographic
A new nationwide survey released by Visa Inc. shows that American households plan on spending a whopping $324 on promposals. Promposals have become significantly more extravagant in recent years and now represent in excess of one third...
Practical Money Skills
Practical Money Skills: Lunch Spending Survey Infographic
According to the results of a new survey commissioned by Visa, respondents reported spending an average of $53 per week on lunch. Overall, the most popular spot to eat lunch was at home (42%), and full-time employees tended to stick...
Other
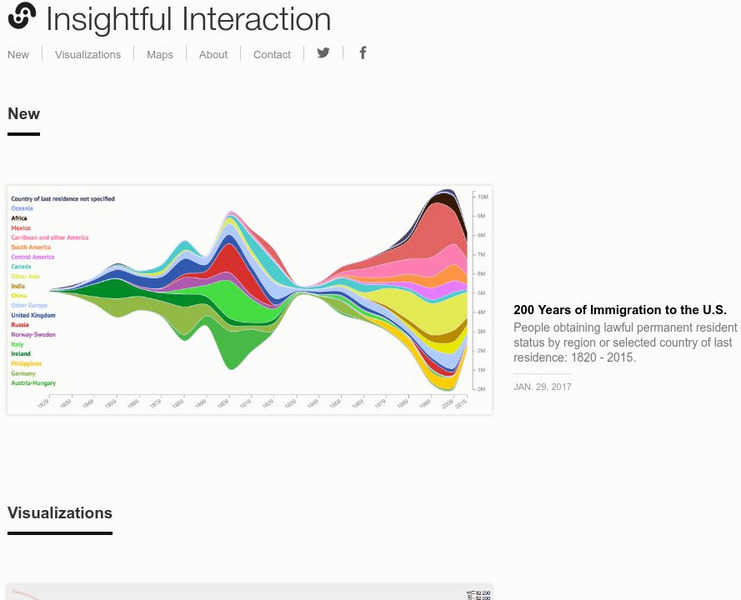
Insightful Interaction: Visualizations
A collection of interactive visualizations that were produced through analysis of economic, political, and market research data. Topics are diverse, e.g., military spending and trade, immigration, consumer spending, crime, unemployment,...
Curated OER
Spending and Output Strings
In this classroom activity, "output" cards and "spending" cards are placed on a string. As each increase or decrease, the economy faces more unemployment or inflation. A good visual device to study the relationships among output,...
Curated OER
Spending and Output Strings
In this classroom activity, "output" cards and "spending" cards are placed on a string. As each increase or decrease, the economy faces more unemployment or inflation. A good visual device to study the relationships among output,...
Curated OER
Spending and Output Strings
In this classroom activity, "output" cards and "spending" cards are placed on a string. As each increase or decrease, the economy faces more unemployment or inflation. A good visual device to study the relationships among output,...
Curated OER
Spending and Output Strings
In this classroom activity, "output" cards and "spending" cards are placed on a string. As each increase or decrease, the economy faces more unemployment or inflation. A good visual device to study the relationships among output,...
Curated OER
Spending and Output Strings
In this classroom activity, "output" cards and "spending" cards are placed on a string. As each increase or decrease, the economy faces more unemployment or inflation. A good visual device to study the relationships among output,...
Curated OER
Spending and Output Strings
In this classroom activity, "output" cards and "spending" cards are placed on a string. As each increase or decrease, the economy faces more unemployment or inflation. A good visual device to study the relationships among output,...
Curated OER
Spending and Output Strings
In this classroom activity, "output" cards and "spending" cards are placed on a string. As each increase or decrease, the economy faces more unemployment or inflation. A good visual device to study the relationships among output,...

