Curated OER
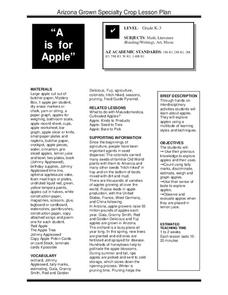
A is for Apple
Learners participate in a variety of activities to learn about apples. Students graph apples, learn about apple uses, taste apples, and observe what happens when apples are dipped in lemon juice.
Curated OER
Building a Pill Bug Palace
Students make "pets" of isopods (potato bugs) to determine their preferred environment and food sources. They record their results on a bar graph and in a scientific report.
Curated OER
Lunchroom Trash
Students explore the amount of waste produced by humans. In this ecology instructional activity, students predict which lunch bag and its contents will produce the most waste. Leftover material is examined, amounts are recorded, and a...
Curated OER
Delicious Graphing
Fourth graders sort trail mix by type and use that information to create different types of graphs for comparing.
Curated OER
Community Construction Kit
Students engage in a lesson designed to be used with the Print Gallery section in the Community Construction Kit. The Print Gallery is a library of photographs, which provides students with an auditory description of each dwelling...
Curated OER
The Guise of a Graph Gumshoe
Eighth graders practice constructing bar, circle, and box-and-whisker graphs. They practice reading and interpreting data displays and explore how different displays of data can lead to different interpretations.
Curated OER
Graphing With Second Graders
Second graders sort M & M's and then enter the data into a spreadsheet in order to create a simple graph. After printing the spreadsheet generated graph, have students compare the printed graph with their paper graph.
Curated OER
Graphing
Fifth graders create graphs based on climate in South Carolina. They read and interpret information in a chart and construct a graphy from the information in the chart. They create a spreadsheet using Excel and publish 2 graphs.
Curated OER
Halloween Graphitti
Students complete multi-curricular activities in a Halloween themed lesson. In this Halloween lesson, students examine newspaper ads to find prices of pumpkins and use them to complete a stem and leaf plot. Students find the diameter,...
Curated OER
WHAT IS THE POPULAR COLOR?
Fourth graders graph cars according to their colors. They complete the graph including a title, scale, x-axis, and y-axis. Students collect the data and choose the type of graph to be made.
Curated OER
Raisin the Statistical Roof
Use a box of raisins to help introduce the concept of data analysis. Learners collect, analyze and display their data using a variety of methods. The included worksheet takes them through a step-by-step analysis process and graphing.
Curated OER
Mmm, Mmm, M&M's
Here is another version of the classic M&M math lesson. In this one, upper graders utilize the ClarisWorks Spreadsheet program in order to document the data they come up with from their bags of M&M's. After making their initial...
Curated OER
Building Sets of 13 and 14
Compose and decompose sets of 13 and 14 and compare sets of each with your little learners. They use objects to construct sets of 13 and 14, record their answers, and compare sets in several different ways.
Curated OER
Bus Graph
Students make predictions about which bus takes the most/least students in the classroom. They use KidPix bus stamp for each student who goes home on that bus number and record data and discuss predictions.
Curated OER
Jack and the Beanstalk Math
Students listen to Jack and the Beanstalk and determine what they think are the most common words. In this Jack and the Beanstalk lesson plan, students reread the story, count the words they chosen and graph those words. Students...
Curated OER
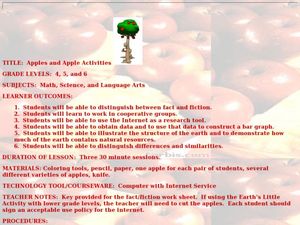
Apples and Apple Activities
Students investigate apples. In this reading comprehension activity, students read a book about apples then compare and contrast, make graphs, distinguish between fact and fiction and work in groups. Students work in...
Curated OER
Where the Buffalo Roam
Students lear about energy, energy efficiency and consumption. They measure energy use, graph the date, write a letter then design and present a PowerPoint on the topic.
Captain Planet Foundation
Shape Shifters in the Math Garden
Combines mathematical measurement with gardening skills. Third graders hunt for worms in the garden and try to find the longest one. They also measure and weigh vegetables that they harvest from the garden, measure rainfall amounts,...
Curated OER
How's The Weather?
Students make a box and whiskers plot using the TI-73 graphing calculator. Each student would have their own calculator but they would work in small groups of two or three to help each other enter the data and make the plots.
Curated OER
Misleading Graphs Lesson Plan
Students design and build water balloon catchers from random scrap materials, while taking into consideration a multitude of variables including: cost, maintenance, total capacity, etc.
Curated OER
Bubbles
Third graders perform an experiment using different mixtures of dishwasher detergent. They construct bar graphs that record their bubble data for each detergent set.
Curated OER
Weather for Health
Ninth graders encounter various types of numerical information (represented in multiple ways), much of which is abstract and difficult to comprehend. In this lesson, 9th graders will convert given information into bar graphs. In the...
Curated OER
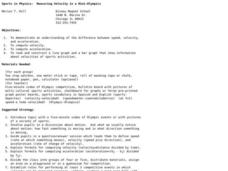
Sports in Physics: Measuring Velocity in a Mini-Olympics
Eighth graders examine the difference between speed, velocity and acceleration. For this velocity lesson students read and construct a line graph and a bar graph to show information about velocities of sports activities.
Curated OER
Tracks are for Trains
Second graders collect data on different forms of transportation and create a bar graph or pictograph with the information.


