Curated OER
Weather the Storm
Fourth graders complete multi-curricular activities for weather. For this weather lesson, 4th graders complete creative writing, research, and weather data analysis activities for the lesson.
Curated OER
Exploring the Stock Market
Students explore their options in stocks. In this algebra lesson, students create a portfolio for their future in stocks. they discuss their choices with a broker and presents their portfolio to the class.
Curated OER
Weather
Students create a spreadsheet and chart using data collected. In this weather instructional activity, students select five cities from their state, including the city they live in. Students take daily temperature readings...
Curated OER
How Fast Is Your Car?
Eighth graders discover the relationship between speed, distance, and time. They calculate speed and represent their data graphically. They, in groups, design a ramp for their matchbox car. The goal is to see who's ramp produces the...
Curated OER
Box-and-Whisker Plots
Eighth graders measure in feet and inches and convert to explore the relationship between the converted measurements. In this measurement lesson, 8th graders use the whisker and box plot to represent the measurement of a cat. ...
Curated OER
Favorite Christmas Carols
Third graders take a survey of friends' and family members' favorite Christmas carols. They illustrate a favorite Christmas carol and have students try to guess the name of the carol based on the picture.
Curated OER
How Does it Affect Plants?
Students examine the effects of acid rain on plants. They observe the growth of seeds and the health of different plants for a month. They share their findings with the community.
Curated OER
Water & Ice
Students investigate the properties of water. In this states of water activity, students explore how water goes from liquid to solid and back to liquid again. Students use measurement, observation, and communication to describe the change.
Curated OER
Lucky Number
Students use data from simulations to make theoretical generalizations. They discuss possible relationships between several given events and gain understanding about their own mathematical intuition about likelihood.
Curated OER
Dr. Teeth and Dr. Gums To The Rescue
Second graders role play as dentists researching teeth and their care. They create a slide show showing how a character, Bear, can take care of this teeth explaining habitats, diets and teeth.
Curated OER
The effects of microgravity
Fourth graders are given a scenario in the lesson that presents a problem that needs to be solved. They conduct research from multiple sources in order to gather information. This is used to contribute to possible solutions proposed by...
Curated OER
How Unique Are You?
Students explore how genetic information is passed down from parent to offspring. Because of this, they examine how this causes the variation in each species.
Curated OER
Comparison of Snow Cover on Different Continents
Students use the Live Access Server (LAS) to form maps and a numerical text file of snow cover for each continent on a particular date. They analyze the data for each map and corresponding text file to determine an estimate of snow cover...
Curated OER
Creating and Comparing Climographs
Students are introduced to the importance and usefulness of climographs. In groups, they create a climograph of two cities on about the same latitude. They compare and contrast the locations and climates of the two cities and write a...
Curated OER
Electric Field Mapping in 3D
Students create a 3D vector field map of an electric field. In this physics lesson, students measure the voltage inside an aquarium with water. They present their findings and map to class..
Curated OER
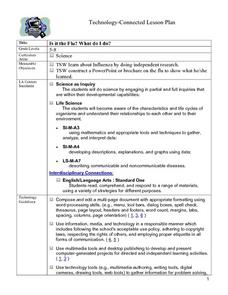
Is It The Flu? What Do I Do?
Students use the internet to research the flu. Using various websites, they identify who should get flu shots, how to protect themselves and guidelines for getting over the flu. They write a one page report on their findings to end the...
Curated OER
A Bird's Eye View of our 50 States
Third graders focus on state birds as they learned absolute location (latitude/longitude) of each state, as well as their relative location (bordering states).
Curated OER
Phenomenal Weather-Related Statistics
Eighth graders research, collect and interpret data about weather statistics. They record that data on spreadsheets. they create Powerpoint presentations on their individual or group research.
Curated OER
Investigation of Timbre
Students design an experiment to analyze the timbre of different instruments. In this physics instructional activity, students analyze the missing quality in sound. They discuss their results in class.
Khan Academy
Khan Academy: Make Bar Graphs 1
A practice quiz where students construct bar graphs using the given information. Includes hints.
Shodor Education Foundation
Shodor Interactivate: Misleading Graphs
This lesson will challenge young scholars to think creatively by having them design and build water balloon catchers from random scrap materials, while requiring them to take into consideration a multitude of variables including cost,...
Illustrative Mathematics
Illustrative Mathematics: Favorite Ice Cream Flavor
The purpose of this task is for students to represent and interpret categorical data. As a class, students will answer a question with three possible answers and construct a bar graph with the responses. Multiple discussion questions and...
Illustrative Mathematics
Illustrative Mathematics: 8.sp.4 Music and Sports
This task looks at a possible relationship between playing a sport and playing a musical instrument. Students collect data from classmates, summarize the data into a two-way table, make some observations, and construct a bar graph of the...


