Curated OER
Favorite Farm Animals
Students perform a study of farm animals and their babies. They compile a graph of their favorite farm animals. They utilize a spreadsheet worksheet which is imbedded in this plan.
Curated OER
Using Diagrams in Problem Solutions
Students use tables, graphs and diagrams to collect data. In this problem solving with diagrams lesson plan, students construct their own tables and graphs containing information they gather from a drawing. They also make a Venn Diagram...
Curated OER
Inching Worms
Third graders have a blast trying to measure live, wiggly, stretching worms to the nearest inch. Groups record their data onto a class graph and then compare characteristics. They share their findings with the rest of the class. Fun lesson!
Curated OER
How Far Will It Roll?
Students construct a car with the longest roll using a ramp. They construct Lego cars, modify the wheel sizes and car configurations to evaluate which car design rolls the longest distance, develop a graph, and complete a worksheet.
Curated OER
Labeling the World
Sixth graders conduct research on the countries found on the labels on their clothing. They locate the countries on a map, research the labor practices on countries that export clothing to the U.S., and create a graph using the information.
Curated OER
A Country’s Shape Is More Than Its Borders
In this geography skills worksheet, students read an article and examine graphs about population prior to answering 13 short answer questions and 10 multiple choice questions. Students then respond to the writing prompt about population.
Curated OER
Can You Identify Arthropods?
Third graders sort and classify the four Arthropod classes. They are given puzzle pieces of one Arthropod example. Each group is to put their puzzle together, glue it on a piece of construction paper and label the ir puzzle.
Curated OER
Math: How Many Red M&Ms?
Sixth graders calculate the mean, median, and mode of candy M&Ms and find the percentage of each color. Once they complete the assignment, they compare their results with those of the candy company's percentages. As an extension,...
Curated OER
Saving Money Through Mathematics
Third graders discuss light sources and collect data about energy sources. They compare data and create a multiple line graph showing energy used by light sources for each student in the group. They present their graphs and write a...
Curated OER
Linking Real World Data to the Classroom
Students analyze data representing real life scenarios.In this algebra lesson, students collect, plot and analyze data using a graph. They use different methods to represent and present their data.
Curated OER
The Effects of Environment on Plant Growth: Selecting Seeds for Survival on a New Planet
Fifth graders conduct experiments to compare seed germination and plant growth rates. They construct a hydroponic plant unit and a lighthouse. They care for the plants for a month and collect data for graphs. They write a report.
Curated OER
Comparing Amount of Rainfall in Different Geographical Areas
Students construct rain gauges and use them to log rainfall in their school zone, local city, and region and then compare and discuss them by plotting this information.
Curated OER
Responsibility: Caring for Classroom Virtual Pets
Students define the term "responsibility". As a class, they participate in voting on different ideas presented to them and develop a graph showing the results. They use the internet to virtually take care of the adopted pet of the class.
Alabama Learning Exchange
The State Capital of Stem and Leaf
Students explore the concept of stem and leaf plots. In this stem and leaf plots lesson, students plot the 50 US states' capitals on a stem and leaf plot according to the first letter of each state. Students compare...
Curated OER
My Peanut Butter is Better Than Yours!
Learners explore the concept of statistical data. In this statistical data lesson, students read an article about the dangers of peanut butter to those who are allergic. Learners perform a taste test of two different brands of peanut...
Curated OER
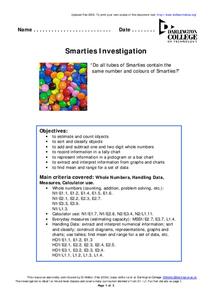
Smarties Investigation
In this math worksheet, learners participate in an investigation of Smarties candy. For example, students estimate how many candies they have in each color, count the actual number, and record the information in a tally chart.
Curated OER
Fly Away With Averages
Students study mean, median, and mode. They construct paper airplanes and test them to see how far they fly. They measure the distance and then find the averages of their throws. They use spreadsheet software to record the data in a...
Curated OER
Fly Away With Averages
Students discover the process of finding the mean, median, and mode. Through guided practice and problem solving activities, they use a computer program to input data and create a graph. Graph data is used to calculate the mean,...
Curated OER
What Do Plants Need to Grow?
Fourth graders control variables to determine the effect on plant growth. They collect information by observing and measuring and construct simple graphs, tables, maps and charts to organize, examine and evaluate information.
Curated OER
Space: The Final Frontier
Sixth graders construct a graph to demonstration information that they've learned about the solary system. They also write or illustrate a sonar or lunar eclipse.
Curated OER
Environmental Mathematics
Eighth graders determine food that they would need to survive in the wild. They graph the best foods for their environments and rate the survivability rate for each member of their group.
Curated OER
One Square Foot
Students identify, describe, count, tally, and graph life found in one square foot of land.
Curated OER
The Stock Exchange Phase I
Second graders select a stock and follow its ups and downs, using graphs to show its success.
Curated OER
Launching Rockets
Second graders discuss experiences of watching a rocket launch either on television or in person before making paper rockets. They make and color rockets which they attempt to launch using a strong breath blown through a straw at the...


