Curated OER
Maximum Power Point
Students investigate energy using a photovoltaic cell. In this electricity lesson plan, students collect data from current-voltage and power-voltage curves to determine if photovoltaic systems have an advantage over conventional electric...
Curated OER
It's All About Scale
Sixth graders investigate scale models of toys. In this scale models of toys lesson plan, 6th graders bring in toys from home to measure. Students discuss scale and what scale is used with their toys. Students determine...
EngageNY
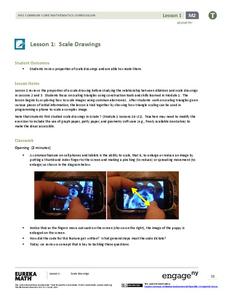
Scale Drawings
Are you searching for a purpose for geometric constructions? Use an engaging approach to explore dilations. Scholars create dilations using a construction method of their choice. As they build their constructed dilation, they...
Curated OER
Bridge Design and Bridge Building
Seventh graders conduct an investigation into the design of bridges and their construction. Students design bridges and draw detailed plans. For assessment they construct a model of a bridge that is made entirely of toothpicks. Students...
Curated OER
Systems of Word Problems
Ninth graders investigate systems of linear equations. In this Algebra I lesson, 9th graders explore word problems that can be solved by using a system of equations. The problems involve such topics as cell phone usage,...
Curated OER
M&M Graphing
Fourth graders name colors of M&Ms and record answers. They estimate number of M&Ms of each color found in a typical package of M&Ms on piece of paper.They record information on sheet of paper and create a spreadsheet. paper.
Curated OER
You Gave Me What?
Students see how an infectious disease such as AIDS may be quickly transmitted throughout a population. They conduct a simulated transmission of an infectious disease and mathematically determine the number of possible infected individuals.
Curated OER
Coloring Interval Graphs
Students investigate planning an activity and getting it done on time. In this algebra lesson, students define vocabulary words related quadratic equations, including the vertex and intervals. They figure a good way to color graphs...
Curated OER
Business & Statistics: Final Exam
In this business and statistics worksheet, learners read real-life business problems, arrange data, and identify the probability method best used to determine the answer. They identify the type of random sample, draw stem-and-leaf plots,...


