Curated OER
Estimation of Population Growth by Counting Offspring: Seed Multiplication
Students analyze a multi-seeded fruit, such as tomato, pepper, squash, watermelon, etc. They remove and count the seeds from the fruit and hypothesize/calculate the reproductive rate of that organism.
Curated OER
Active Wear
Students interpret and analyze data. For this middle school mathematics lesson, students conduct an experiment in which they investigate which solar collector, black, white, or silver, absorbs the most heat. Students examine the graphs...
Curated OER
Higher Order Taylor Polynomials
In this polynomial worksheet, students approximate values of linearly using the tangent line. They use first and second-degree polynomials to find the equation of a line tangent to a graph. Students explore Taylor's Theorem. This...
Curated OER
Forces and Motion-The Downhill Racer
Learners calculate a toy car's velocity and acceleration. In this force and motion lesson, students build ramps and attach a dropper to a toy car, which is released down the ramp. Learners calculate and graph velocity and acceleration...
Curated OER
Guess the Age
Students describe graphically, algebraically and verbally real-world phenomena as functions; identify the independent and the dependent variable. They translate among graphic, algebraic, and verbal representations of relations and graph...
Curated OER
Guess the Age
Students explore functions using real world application. In this algebra activity, students play a game as they apply concepts of function. They graph their findings and discuss it with the class.
Curated OER
Nuclear Chemistry Homework Problem Set
In this nuclear chemistry worksheet, students evaluate data from concentration experiments on radioactive iodine. They graph the data, determine radioactive decay and half life for the element.
Curated OER
Worksheet 22-Fall 1995
In this math activity, students examine the graph of the derivative. Then they determine the critical points that correspond to the relative extrema.
Curated OER
A Look at Race in America Using Statistics
Eleventh graders explore the issue of racism in America. In this American History lesson plan, 11th graders analyze charts and graphs on blacks and whites in America.
Curated OER
Differential Equations
In this differential equations worksheet, students solve and complete 3 sets of various problems. First, they solve each of the differential equations. Then, students use the given information to evaluate the constant of integration....
Curated OER
Hang Time
Students use the equation to calculate the vertical distance an object fall during 1 second in 1/10 second increments. (The acceleration due to gravity on the Earth=a= 9.8 m/s2) Using a graphing calculator, students plot the path of a...
Curated OER
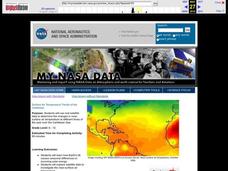
Surface Air Temperature Trends of the Caribbean
Students investigate the seasonal changes to sea surface and near-surface air temperatures near the equator. They use actual satellite data to track and graph the differences in air and sea temperatures during different seasons in the...
Curated OER
Motion
In this motion worksheet, students will read 8 statements about displacement and velocity and determine if the statement is true or false. Then students will fill in the blank for 8 statements on motion. Finally, students will compare...
Curated OER
Mathematics and Ecology: Through the Window Garden
Student discover some of the ideas and concepts that make up the topic of Ecology. They read and interpret graphs to assimilate the information that is displayed. They discover the rate of increase of Carbon dioxide in the atmosphere...
Curated OER
Average and Instantaneous Velocity
In this velocity worksheet, students determine the average velocity for a trip, graph the distance traveled as a function of time, estimate the slope and identify the instantaneous rate of change of the function. This two-page worksheet...
Curated OER
Forces and Motion -- The Downhill Racer
Pupils examine the movement of a car on an inclined plane and on a flat surface. Using the amount of drops the car releases, they determine if it was traveling at a constant speed or not. They graph the velocity and acceleration rates of...
Curated OER
Scientific Notation III: Linear vs Exponential
Students examine the differences in exponential growth and linear growth of a system. They interpret data on graphs and develop their own charts. They answer discussion questions as well.
Curated OER
Algebra I: A Draining Swimming Pool
Students analyze and develop symbolic representations to describe the amount of water left in a pool being pumped out after a given amount of time, with various pumping rates and initial quantities of water in the pool.
Curated OER
Tracking Speed
Young scholars collect data for a runner by measuring the time it takes for the runner to run equal distances. After collecting data, students average speeds and accelerations for the runner. Assignment is completed by graphing the data.
Curated OER
Responding to Alcohol: What's Important?
Students examine the effects on motor functions in mice. They make observations and graph their data. They analyze the data and draw conclusions in each of the three experiments.
Curated OER
Estimation of Population Growth By Counting Offspring: Seed Multiplication
Learners calculate the reproductive rate of a plant that creates multi seed fruits. They graph exponential growth and the complete a series of questions that help them infer that natural selection processes are at work in this population.
University of Utah
Explore Proportional and Linear Relationships
Progress from proportional relationships to linear functions. Pupils first review concepts of proportionality covered in earlier grades. They then extend these concepts to linear functions, such as determining the slope of a line using...
Mathematics Vision Project
Module 3: Arithmetic and Geometric Sequences
Natural human interest in patterns and algebraic study of function notation are linked in this introductory unit on the properties of sequences. Once presented with a pattern or situation, the class works through how to justify...
Mathematics Vision Project
Module 1: Sequences
Sequences are all about recognizing patterns. A module of 11 lessons builds pupils' understanding of sequences through pattern analysis. The practice connects the analysis to linear and exponential equations. This is the first module in...


