Curated OER
SAT Grid Ins Practice Test 05
For this SAT practice test worksheet, 12th graders answer 10 short answer questions. Questions are from a variety of topics, but mainly ask about geometry concepts. The test is self-scoring.
Curated OER
Solving Fractional Equations
For this algebra worksheet, 11th graders solve irrational functions by identifying the variables and make sure the equation is a true statement. They solve word problems also. There are 12 questions with an answer key.
Curated OER
Biological and Agricultural Engineering
Eighth graders explore mathematics by conducting a series of investigations using a colorimeter. In this math lesson, 8th graders explain the purpose of food irradiation. They collect data and graph them.
Curated OER
Equations 1
Students discuss the meaning of balance and how it applies to equations. After listening to a lecture, they practice solving equations with two orders of operation and doing whatever they do on one side to the other side as a class. To...
Curated OER
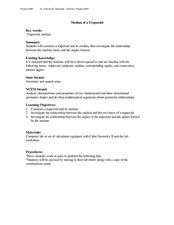
Median of a Trapezoid
Students find the median of trapezoids and other polygons. In this geometry lesson, students identify important properties of trapezoids. They create trapezoids and polygons using Cabri software.
Curated OER
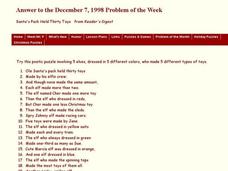
Santa's Pack Held Thirty Toys
In this geometry worksheet, 10th graders use the given clues to determine which of Santa’s elves dressed in which color and made which toy. The one page worksheet contains one problem with twenty-four clues. Answer provided.
Curated OER
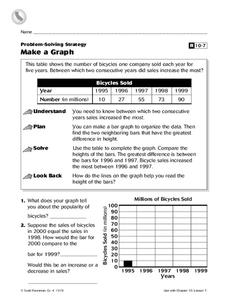
Make a Graph
In this graphs worksheet, 4th graders, after studying and analyzing a table on bicycles sold within several years, answer 2 short answer questions relating to the table.
Curated OER
Surface Meteorological Observation System (SMOS)
Learners monitor local surface weather conditions for at least 30 days. They interpret the data by graphing it and detemining percentages.


