Curated OER
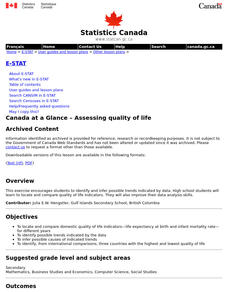
Assessing Quality of Life
Eleventh graders research quality of life indicators for a list of countries looking at such things as infant mortality rate, and gross domestic product. They rank the countries from best to worst regarding quality of life issues.
Curated OER
Tessellations in Excel
Students complete an Excel project on tessellations. In this technology and math lesson plan, students discuss tessellations and their occurrences in nature. Students use the Excel computer program to create tessellations.
Curated OER
Choose or Lose: The Electoral Process
Students examine the local and national election process. In groups, they brainstorm a list of the issues important to them and compare them to an overall list of issues present in the election. They analyze graphs and complete...
Curated OER
Current Events Research
Students monitor current events using on-line and traditional resources. They explore issues such as what trends they see developing in specific news issues over time and how different news stories might be interrelated.
Curated OER
Rebuild Your Community
Students explore the concept of rebuilding a community after a disaster. In this rebuilding after a disaster instructional activity, students discuss the role of government in rebuilding a community. Students discuss financial issues...
Curated OER
Graphic Favorite Breakfast Foods
Second graders graph data based on a class survey of their favorite breakfast foods. In this graphing lesson plan, 2nd graders take a class survey of their favorite breakfast foods. Then they take that data and put it into a computer...
Curated OER
Cross Cultural Transportation and Resources Exchange
Students examine various modes of transportation. They explore regional transportation options and discover options available in their area. Students survey types of transportation people use in their area. Using spreadsheet data,...
Curated OER
Pop Clock
Learners review the Census Bureau's Homepage, gather information regarding population trends in order to make predictions on future populations.
Curated OER
Virtual Field Trip
Are we there yet? Young trip planners learn about their state and plan a trip. They will select sites to see in three cities in their state, and record associated costs in a spreadsheet. While this was originally designed as a...
Curated OER
Publisher Brochures
Learners create brochures on subjects they are studying in Publisher. In this nonfiction writing lesson, students use Publisher to create a brochure telling all the main ideas of a topic they are studying. Learners use text boxes, fonts...
Curated OER
Botanical Discoveries
Sixth graders examine the Lewis and Clark Expedition. For this plant discovery lesson, 6th graders put in chronological order the plant discoveries of Lewis and Clark. Students understand the characteristics of leaves and find the area...
Curated OER
Fast Food Survey Using Bar Graphs
Second graders create a bar graph to pictorically represent the data collected from a survey of students. They use Excel to electronically create the graphs and data tallies. They then interpret their data using sentences to explain.
Curated OER
The Politics Of Taxation
High schoolers explain that taxation involves a compromise of conflicting goals and that lobbyists can influence lawmakers' decisions about taxes. They can explain why people of similar incomes often pay different tax rates and work in...
Curated OER
A is for Area, B is for Billion
Students interact with math terminology in preparation for standardized assessment. In this math terminology and online storybook lesson plan, students create their own booklets of math terms based on each letter of the alphabet. Over...
Curated OER
Gender and Income
Students investigate Income and gender preference. In this statistic lesson, students collect data of Income to see if one gender makes more than the other. Students examine the data and draw conclusions.
Curated OER
Planets an Introduction
Fourth graders investigate one planet, enter information into a database, and print the database sorting for each of the attributes.
Curated OER
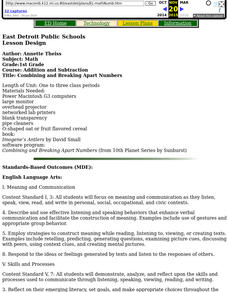
Combining and Breaking Apart Numbers
First graders read Imogene's Antlers by David Small the create pipe cleaner antlers. Using these as a tool students combine and create number sentences. They continue to work through the framework of a software program.
Curated OER
Body Proportion
Fourth graders measure the height and arm span of various classmates. They use a spreadsheet to design a graph that shows the class measurements from tallest to shortest in metric and standard systems.
Curated OER
Timed Multiplication Test Graphs
Students use the tools of data analysis for managing information. They solve problems by generating, collecting, organizing, displaying histograms on bar graphs, circle graphs, line graphs, pictographs and charts. Students determine...
Curated OER
Fast Food Survey Using Bar Graphs
Second graders conduct survey and sort data according to categories, construct bar graph with intervals of 1, and write a few sentences about their graphs.
Curated OER
Virtual Field Trip / Activity Research
Students visit a website to determine activities at three Michigan cities. They calculate the total cost of participating in the activities or visiting places such as zoos, planetariums, historic sites, and museums.
