Curated OER
Graphing on the Computer
Students create a bar graph on the computer using given information from the teacher. They create a bar graph using their own information chart (they need to create one on separate paper first). They utilize Microsoft Excel for this...
Curated OER
Implementing Algorithms Using Matlab
In this math worksheet, students practice implementing algorithms using the computer program of Matlab. They practice using the programs of scripts and functions.
Curated OER
Nutrition and Food Security
Examine the three basic nutrients and their effects on the body. Fifth graders will research data to construct a bar graph and then demonstrate the relationship between malnutrition and food security. This is a very comprehensive...
Alabama Learning Exchange
Swim the Open Sea: Analyzing Duel Vectors
This dual vector lesson has the class watch a video about a person's swim of the English Channel. The class then uses a computer program to analyze dual vectors of wind's effect on a flight path of a plane as compared to the water...
Curated OER
Measuring "pHacts" about Acid Rain
Sixth graders gather and graph information regarding the pH of rain. Working cooperatively with an internet partner, 6th graders gather and record information about the pH of the rain in their local area. They graph this information...
Shodor Education Foundation
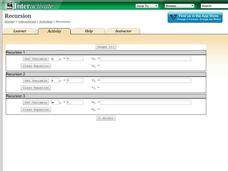
Recursion
Perform the operation ... and then do it again. Scholars investigate recursive formulas by creating and graphing them. Using the interactive, pupils set the variable, determine the initial value, and type in a recursive formula.The...
Shodor Education Foundation
Two Variable Function Pump
Use a function to operate on two variables. Pupils look at operating with complex numbers as a function of two variables. The interactive squares the input and adds a constant to it. Learners visualize the resulting output and its...
Curated OER
Excel temperature Graphs
Students gather data about the weather in Nome, Alaska. In this Nome Temperature lesson, students create an excel graph to explore the weather trends in Nome. Students will find the average weather and add a trend line to their graph.
Curated OER
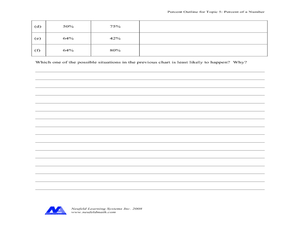
Percent of a Number
In this percent worksheet, students complete problems such as changing percents to decimals, filling in percentage charts, and more. Students complete 8 problems.
Curated OER
Geometry Shapes Playground Safety
Learners create a new playground design to present to elementary students during Playground safety week. They review basic geometry to use in observing and recording the equipment on a local playground. They research playground safety...
Curated OER
Big Wheels Keep on Turning
Eleventh graders work in groups and investigate how force determines the speed and distance then they view the video, "Math Vantage #7: What's Your Angle?." They are given a real life problem to solve using speed, ramps, angle, incline...
Curated OER
Smarty pants puzzles
In this word problem learning exercise, students view word problems that represent lemonade stands and state whether they are true, unknown, or false. Students view 2 different lemonade stand prices and values.


