Curated OER
Yummy Math
Young mathematicians use bags of Skittles to help them gain practice in graphing and organizing data. They work in pairs, and after they have counted and organized their Skittles, they access a computer program which allows them to print...
Curated OER
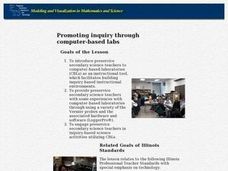
Promoting Inquiry Throught Computer-Based Labs
Student Teachers are given the opportunity to examine how to use a computer-based laboratory for inquiry. The practice is done to teach future teachers how to use these tools so they can be ready for use in the classroom environment.
Curated OER
Math: Matching Rods and Religion
Math and religious studies are integrated together using using cuisenaire rods and Kid Pix for this problem-solving exercise. In pairs, they match different colored rods to represent various groups of people. Meanwhile, students at...
Curated OER
Exploring Linear Equations And Scatter Plots - Chapter 5 Review
Students complete rolling stocks experiment, and collect and enter data on the computer. They enter data on graphing calculators, complete scatter plot by hand with line of best fit, and discuss different graphing methods.
Curated OER
Excel for Beginners
In this Excel lesson, students set a formula to check their homework. Students also use clipart, work in groups, and learn to use the tools in the drop-down list.
Curated OER
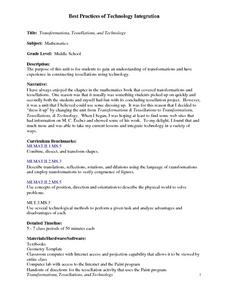
Transformations, Tessellations, and Technology
Young scholars complete a unit about transformations and tessellations. They explore various tessellation websites, determine which shapes tessellate, complete a log about which website activities they complete, and create a...
Curated OER
Tessellations in Excel
Young scholars complete an Excel project on tessellations. In this technology and math lesson, students discuss tessellations and their occurrences in nature. Young scholars use the Excel computer program to create tessellations.
Curated OER
Using Excel to Draw a Best Fit Line
Young scholars create line graphs for given data in Microsoft Excel. Students follow step by step instructions on how to create their graph, including how to create a trend line. Young scholars print graphs without trend lines and...
Curated OER
The Android Factory
Students explore the idea that primitive virtual 3D objects can be reshaped to infinitely original combinations using additive and subtractive methods. They create 3-D objects with a computer which necessitates a cooperation of...
Curated OER
Math Games
Fourth graders participate in a lesson that is involved in the breaking of codes using computer games. They access the internet to play math games. The teacher uses powerpoint to help guide students with common problems in loading and...
Curated OER
Shapes And Colors
Students distinguish between circles, squares, and rectangles and various colors in which they utilize the KidPix program on the computer to create them. They alternate; allowing each student to have a turn constructing and coloring in...
Curated OER
Fractals Forever or Obvious and Hidden Order
Students discuss ways computers use properties of similar figures to generate scale models and create scenes. they describe patterns they have seen on a fern, pineapple, or pinecone. Students research Benoit mandebrot, H. von Koch and...
Curated OER
Color Me Square
Second graders identify and describe basic geometric solids. Working as a class, 2nd graders describe geometric solids using the proper vocabulary and counting faces, bases, corners, and edges. In pairs, students use a computer drawing...
Curated OER
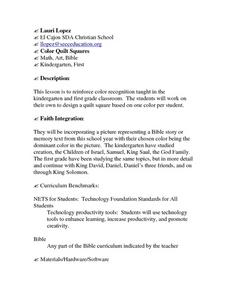
Color Quilt Squares
Students investigate how to mix different colors in patterns. They use the patterns in order to design a quilt. Students create a design for one square. They use computer software to display and practice the creation of quilt squares...
Curated OER
Swinging Pendulum
Students engage in an activity which demonstrates how potential energy (PE) can be converted to kinetic energy (KE) and back again. Given a pendulum height, students calculate and predict how fast the pendulum will swing by understanding...
Curated OER
Student Exploration: Fraction, Decimal, Percent
Students explore the concept of fractions, decimals, and percents. In this number sense lesson, students use a worksheet to guide them through the exploration of the relationship between fractions, decimals, and percents. Students work...
Curated OER
Building Bridges
Students identify the different types of bridges. Using the internet, they research information on how they are built by completing a scavenger hunt. Locating a specific area, they determine which type of bridge would be appropriate and...
Teach Engineering
Lighting in My Classroom Survey
How much energy does it take to light a room? Class members calculate the total wattage it takes to light the classroom. Through calculations, responsible scientists determine the cost of energy for the year, then figure out how much...
Curated OER
Publisher Brochures
Students create brochures on subjects they are studying in Publisher. In this nonfiction writing lesson, students use Publisher to create a brochure telling all the main ideas of a topic they are studying. Students use text boxes, fonts...
Curated OER
Beginning Graphs in MS Excel
Learners practice creating graphs in Microsoft Excel. In this technology instructional activity, students conduct a random survey and collect data. Learners use the Microsoft Excel program to create a bar graph of the data.
Curated OER
How to Graph in Excel
Fourth graders construct data graphs on the Microsoft Excel program. In this statistics lesson, 4th graders formulate questions and collect data. Students represent their results by using Excel.
Curated OER
Fun, Fun, Fun
Students participate in playing online games. In this practice lesson, students play online games to practice skills learned throughout the week.
Curated OER
Asthma Survey
Young scholars collect survey data on the prevalence of asthma in a community. They summarize and display the survey data in ways that show meaning.
Curated OER
Do the Elephants Need Sunscreen? A Study of the Weather Patterns in Etosha
Students analyze the weather patterns in Namibia. They create a graph of the yearly temperatures and use the internet to gather information. They discuss how the weather goes in cycles in the area.
Other popular searches
- Parts Computer
- Parts of a Computer
- Parts of the Computer
- Computer Mouse Parts
- Computer Inside Parts
- Parts of Computer


