Texas Education Agency
Texas Gateway: Data, Sampling, and Variation in Data and Sampling
This learning module discusses quantitative and qualitative data, the use of two-way tables in marginal and conditional distributions, how to display data, variation in data and samples, and how to critically evaluate statistical...
E-learning for Kids
E Learning for Kids: Math: Rice Field: Data and Length
On this interactive website students practice various math skills using a real life scenario of a rice field. Those skills include understanding information displayed in column graphs, collecting data to answer a question, and measuring...
Other
Bscs: Frog Eat Frog World
In this self-directed lesson, students will use maps and Frogwatch data to explore the natural and invasive range of the American bullfrog. A handout with everything the student needs to complete this lesson is available as a PDF or...
Better Lesson
Better Lesson: Using Table Data: Time to the 1/2 Hour
My students have learned how to read and write time. Now I want them to see how important time is for us to organize our lives. I want them to use data charts for schedules and be able to analyze the information.
Better Lesson
Better Lesson: Balancing and Comparing Data
The connection between subjects is an important one to establish for students. Communicating across subjects is part of the Common Core expectations.
Howard Hughes Medical Institute
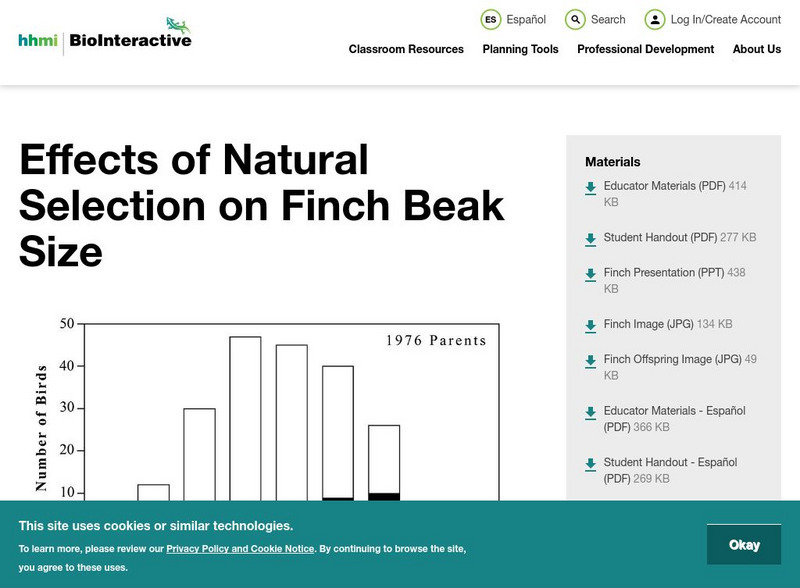
Hhmi: Bio Interactive: Effects of Natural Selection on Finch Beak Size
In this activity, students examine research on finches on the island of Daphne Major in the Galapagos Islands. The depth of the finches' beaks was measured before and after a drought. This data is displayed in graphs and students are...
Science Education Resource Center at Carleton College
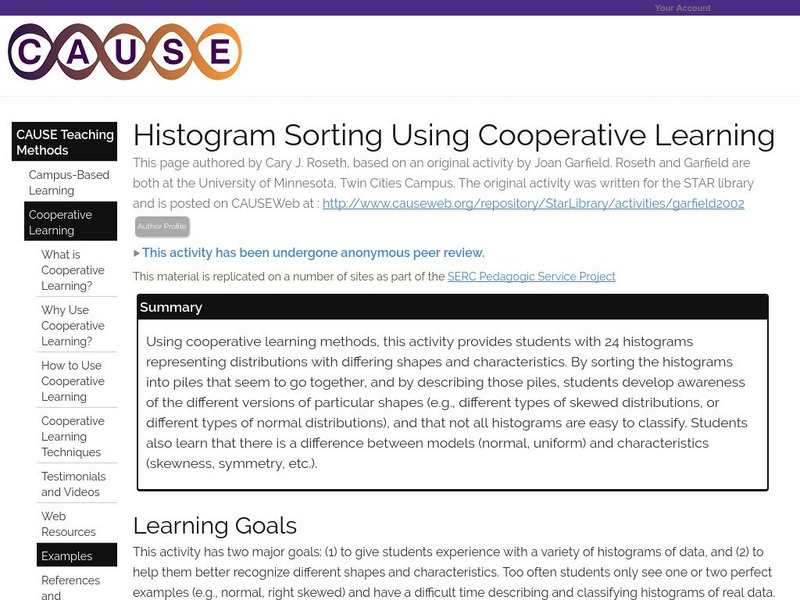
Serc: Histogram Sorting Using Cooperative Learning
Young scholars work with 24 histograms representing distributions with differing shapes and characteristics. By sorting the histograms into piles that seem to go together, and by describing those piles, students develop awareness of the...
Other
Clayton State: Organizing & Presenting a Frequency Dist.
The easiest method of organizing data is a frequency distribution, which converts raw data into a meaningful pattern for statistical analysis. Learn how in this tutorial with examples.
Other
National Security Agency: Line Plots: Frogs in Flight [Pdf]
Students learn how to construct and interpret line plots. The lesson plan describes an activity that has students collect data, create line plots, and interpret and analyze the data.
McGraw Hill
Glencoe: Self Check Quizzes 1 Using Graphs to Make Predictions
Use Glencoe's randomly generated self-checking quiz to test your ability to use graphs to make predictions. Each question has a "Hint" link to help. Choose the correct answer for each problem. At the bottom of the page click the "Check...
University of Utah
University of Utah: Aspire: The Aspire Breadboard
This is a tutorial for creating a breadboard with an LED display as an educational outreach effort for the Telescope Array cosmic ray research project near Delta, Utah. When completed, the breadboard could be programmed to use actual...
Discovery Education
Discovery Education: Comparing Countries
Excellent lesson in which students make predictions and collect information about the United States, China, and the Democratic Republic of Congo. After collecting data, students compare the information and create graphs to display the data.
TeachEngineering
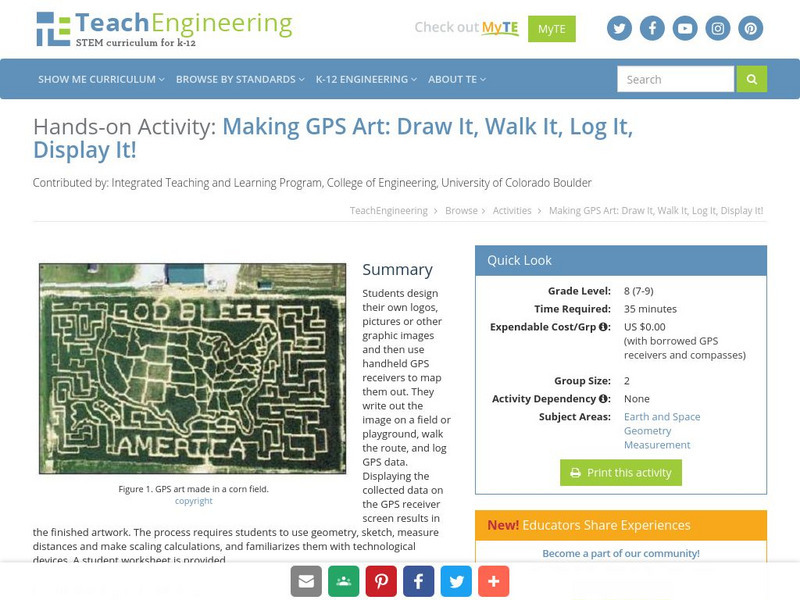
Teach Engineering: Gps Art
Students design their own logo or picture and use a handheld GPS receiver to map it out. They write out a word or graphic on a field or playground, walk the path, and log GPS data. The results display their "art" on their GPS receiver...
Shodor Education Foundation
Shodor Interactivate: Bar Graph Sorter
An applet allows students to sort shapes into a bar graph by color and shape. The learning resource consists of the activity, instructions, instructor notes, and additional resources.
University of Georgia
University of Georgia: Inter Math: Box and Whisker Plot
Description of box-and-whisker plots and their uses, along with a visual representation. There are links to related terms, everyday examples, more information, and the interactive checkpoint involving box and whisker plots located in the...
Better Lesson
Better Lesson: Making a Table
First graders get a chance to use tables when breaking a total quantity into its component parts.
Khan Academy
Khan Academy: Dot Plots and Frequency Tables Review
Dot plots and frequency tables are tools for displaying data in a more organized fashion. In this article, we review how to make dot plots and frequency tables.



![National Security Agency: Line Plots: Frogs in Flight [Pdf] Lesson Plan National Security Agency: Line Plots: Frogs in Flight [Pdf] Lesson Plan](https://content.lessonplanet.com/knovation/original/122495-587001a487c71ef32e76fdab66ff794e.jpg?1661494304)
