Curated OER
Finding Fractional Parts Using an Area Model
Students explore math functions by completing a problem solving worksheet in class. In this division lesson, students utilize visual aides such as marshmallows and candy to visualize the act of division. Students complete a division...
Curated OER
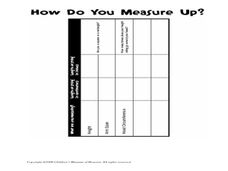
How Do You Measure Up?
Students measure their body. In this measurement instructional activity, students use a string to measure their height and the circumference of their head. They record this information on the worksheet provided and answer questions as a...
Curated OER
Horatio's Ratios
View a PBS video entitled Horatio's Drive and explore Horatio's Ratios. Collaborative learners form groups to use Mapquest to determine distances covered. They generate the mathematical averages, ratios, and rates in order to calculate...
Curated OER
A Statistical Study of the Letters of the Alphabet
Students gather appropriate information for simple statistical analysis. Then they will calculate probability working with a piece of literature that makes this lesson ideal for teaching across the whole curriculum.
Curated OER
Schoolyard Bird Project
Students observe and count bird sightings around their schoolyard throughout the school year.
Curated OER
Graphing Our Marbles
Students collect information pertaining to marble colors found in their bag; then creating a spreadsheet in order to make a chart representing their findings using Microsoft Excel. Students will present their results to small groups.
Curated OER
Graphing
Students collect data to create different types of graphs-line, pie, and bar graphs. They use StarOffice 6.0 to create graphs.
Curated OER
Math: Currency Exchange Rates
Sixth graders apply the division and multiplication of decimals to convert dollars to various international currencies. In a travel simulation activity, they convert money, distance, and temperatures. During their "trip," students...
Curated OER
The Meaning Of Percent
This lesson provides students with a variety of exercises which allow them to increase their ability to understand percentage.
Curated OER
Decimal Place Value Chart
For this decimal place value chart worksheet, students work independently to fill in the blanks on the chart so that the numbers equal out correctly and the missing words are stated correctly.
Curated OER
Differentiating for High Ability Students
You can challenge high ability students in your classroom with these differentiated lesson plans.
Curated OER
Texas History Math
Seventh graders practice math skills while they become familiar with Texas' Boom & Bust economy and the natural history of the east Texas Piney Woods.
Curated OER
Fashion Sense and Dollar Wise
Students find the cost of an outfit. In this percentages lesson, students look at ads, pick out an outfit, and find the sale price. They create a commercial and complete 4 included worksheets.
Curated OER
"Water is Life" Global Water Awareness
Students examine and calculate the percentage of potable water remaining on the earth. In this ecology and geography instructional activity, students brainstorm the main factors affecting water distribution. Students use mathematical...
Curated OER
Length Lotto-Teacher's Notes
Students convert metric units of length, specifically meters, centimeters, and millimeters. In this lesson of converting measurements, students participate in various games which require them to put the measurements in order or convert...
Curated OER
Comparing Data on Graph A and Graph B
Second graders gather and graph data. In this graphing lesson, 2nd graders collect data and graph this information using tally charts, bar graphs, pictographs, or tables. They make predictions about the outcomes.
Pennsylvania Department of Education
Freckle Face
Students collect and record data. In this early data analysis lesson, students gather data about their partners face. As a class, the students use tally marks and pictographs to record the data and answer question about the information...
Curated OER
Proportion
Students investigate proportion and ratio. In this geometry lesson plan, students set up the ratios of proportions correctly and solve for the unknown. They relate it to word problems.
Curated OER
Charging Up, Charging Down: Exponential Models
Students collect and analyze voltage data. In this math lesson plan, students investigate exponential functions using the TI and a Voltage Probe. They graph their data and analyze it using a table.
Curated OER
Circumference of a Pumpkin
Fourth graders watch a video and find the circumference of a pumpkin. In this circumference lesson, 4th graders watch a video to help them find the circumference of their pumpkins. Students define the word circumference on their data...
Curated OER
Reading Trees: Understanding Dendrochronology
Students examine tree-ring dating and discuss the lack of water the settlers in Jamestown faced. They create paper tree rings, simulate rain patterns, and describe the history of construction paper tree sequences.
Curated OER
End of the Year Math Terms
In this end of the year math test learning exercise, 4th graders complete problems including addition, division, measurement, decimals, and more. Students complete 22 problems.
Curated OER
Grocery Store Problem Solving
Students use multiple math skills to complete grocery story problems. In this grocery math lesson, students study grocery ads to learn about the cost of foods. Students investigate food types and the costs of processed versus raw foods....
Curated OER
"Using Manipulatives and/or Technology to Solve Math Problems" by Cooking Dinner
Students explore math functions by preparing a meal. For this food measurement lesson, students examine a recipe for a meal and alter the size of the recipe based upon the amount of servings needed. Students utilize manipulatives to...


