Curated OER
Comparing Value for Money: Baseball Jerseys
Learners step up to the plate as they first complete an assessment task using linear equations to determine the best company from which to buy baseball jerseys. They then evaluate provided sample responses identifying strengths and...
Curated OER
Shake It Up with Scatterplots
Students identify how to use a scatterplot to compare two sets of data to determine if they are related. Then they identify and describe the definition of regression line (the "line of best fit"). Students also identify how scientists...
Mathematics TEKS Toolkit
Grade 6: Exploring c/d = pi
Introduce your math class to the perimeter of a circle. Teach them that pi describes the relationship between the circumference and the diameter. As a hands-on investigation, pairs or small groups use string to compare these two values...
Curated OER
Proteomics
Students analyze data taken from proteomic experiments. In this biology lesson, students explain the importance of bioinformatics tools in the study of proteins. They evaluate scientific results using math and computer software.
Curated OER
Shadow Chasing
The students compare themselves and their shadows to various objects big and small. Students use their data to set up proportions to solve.
Curated OER
Calculating the Cost of a "Sound Basic Education"
Students state their opinions about school funding and the use of monetary resources by school districts and use reasons, facts, and examples to support their ideas. They compare sets of data related to school funding and draw...
Curated OER
Water: From Neglect to Respect
The goal of this collection of lessons is to make middle schoolers more aware of the ways in which they are dependent upon water to maintain their standard of living. Learners compare water use in Lesotho to water use in the United...
Curated OER
Discovering Pi/Welcome to Pi Day
Students explore pi. In this circle measurement lesson plan, students define and identify radius, diameter, circumference, and perimeter. Students work in groups to measure several plastic lids and record their findings. Students compare...
Noyce Foundation
Ducklings
The class gets their mean and median all in a row with an assessment task that uses a population of ducklings to work with data displays and measures of central tendency. Pupils create a frequency chart and calculate the mean and median....
Curated OER
Box-and-Whisker
Seventh graders are introduced to the concept of box-and-whisker plots. A step-by-step process for creating a box-and-whisker plot is provided. The goal of the instructional activity is that students study the components of a...
Curated OER
Exploring Function Graphs
Tenth graders investigate three different sets of data that relate temperature to another variable in the physical world. These illustrate linear, inverse and exponential relationships.
Curated OER
Practicing Arithmetic
Students practice single operation arithmetic ranging from single digit addition to long division of decimals or real numbers using Graphit. They use data sets and rules to graph ordered pairs.
Curated OER
Investigating the Probability
Students investigate probability using coins and dice. They collect data, graph, organize and interpret data. They predict, describe, compare, compute and draw conclusions based on what they observe and record.
Curated OER
Millions, Billions, Trillions
Students use real-world data to compare the relative sizes of millions and billions, and exponential growth. They use the salaries of famous people such as, Michael Jordan and Bill Gates to understand this math concept.
Curated OER
Poll Positions
Learners analyze and graph the results of a nationwide New York Times poll about race in the United States. They poll people in their community regarding their views and experiences, and compare and contrast local and national poll data.
Curated OER
Lines of Best Fit
Students determine if there is an associationm in a scatter plot of data. They analyze data through predictios, comparisons, and applications. Students calculate the line of best fit using a graphing calculator. They display data in...
Teach Engineering
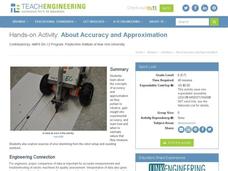
About Accuracy and Approximation
How accurate are robots? Groups draw lines by moving robots backwards and forwards by one rotation of the wheels. Using the appropriate formula, they determine the percent error in the length of the lines in relation to the calculated...
Curated OER
Interpreting Graphs
Sixth graders interpret linear and nonlinear graphs. They create graphs based on a problem set. Next, they represent quantitive relationships on a graph and write a story related to graphing.
Noyce Foundation
Boxes
Teach your class to think outside the box. Scholars use the concept of equality to solve a problem in the assessment task. They determine how to use a scale to identify the one box out of a set of nine boxes that is heavier than the others.
Curated OER
Technology Literacy Challenge Grant Learning Unit
First graders explore counting and classification. They sort leaves, create graphs, write sentences for the data in the graphs, develop graphs for shapes, favorite animals, birthdays, and participate in a die prediction game.
Ohio Department of Education
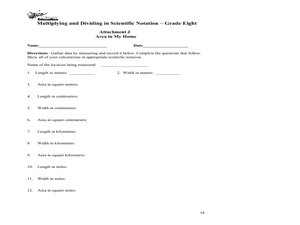
Multiplying and Dividing in Scientific Notation - Grade 8
Here is really nice set of resources on scientific notation. Eighth and ninth graders explore the concept of multiplying and dividing in scientific notation. In this multiplying and dividing numbers in scientific notation lesson,...
Curated OER
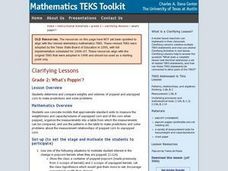
What's Poppin'?
Second graders determine and compare weights and volumes of popped and unpopped corn to make predictions and solve problems. Students combine the data of each group into a graph. They construct questions, statements and story problems...
Curated OER
Exploring Literature and Weather through Chirps
Students explore and experience information about temperature changes by using crickets' chirps to calculate the temperature. The data is applied to formula and the temperatures are calculated.
Pennsylvania Department of Education
Alike and Different
Students compare and contrast objects and are introduced to a Venn Diagram. In this alike and different lesson, students make observations regarding properties of objects. Students classify object and build ideas about variables....


