Curated OER
Earth Day Number Sense
Elementary schoolers count and order objects using numbers 1-300. They bring recyclable items from home. Students group the items, skip count by 2's, 3's, and 5's, and arrange the items on a number line. Recyclable plastic bags are put...
Curated OER
Cold War Conflict in Vietnam: The Vietnam-Era Presidency
Comparing and evaluating various media types is a great way to build critical analysis skills. Learners read about the Vietnam era presidency, specifically the foreign policy established by Johnson and Nixon. Then they compare several...
Curated OER
President Obama's Address to Students Across America
Students write about goals, responsibility, and persistence, and listen to President Obama's speech. In this President Obama lesson students create concept webs, listen with a purpose, and list the challenges of our generation.
Sharp School
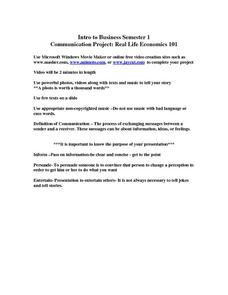
Real Life Economics 101
Your learners will take key economic concepts, such as identifying needs versus wants and the four factors of production, and design a video to explain their topic choice to the class. Rather than have one person in charge of dispensing...
Curated OER
Comparing Shamrock Numbers (I)
In this math instructional activity, students analyze and compare the three numbers in each of 6 shamrocks. Students circle the greatest number in each shamrock. Numbers are between 50 and 100.
Curated OER
Comparing Shamrock Numbers (H)
In this math worksheet, students analyze and compare the three numbers in each of 6 shamrocks. Students circle the greatest number in each shamrock. Numbers are between 50 and 100.
Curated OER
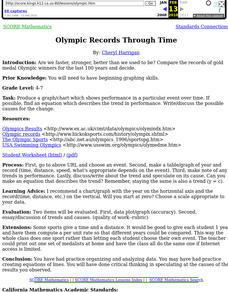
Olympic records through time
Students compare the records of gold medal Olympic winners for the last 100 years and decide if we are faster, stronger than in the past.
Curated OER
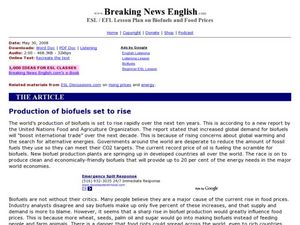
Breaking News English: Production of Biofuels Set to Rise
In this ESL worksheet, students read or listen to an article about the production of biofuels. Students complete all or some of the 100 activities available here including discussion, listening, vocabulary and comprehension.
Curated OER
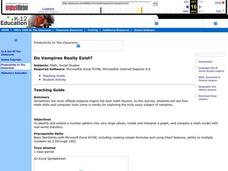
Do Vampires Really Exist?
Students identify and extend a number pattern into very large values. They create and interpret a graph based on their number patterns. Students compare a math model with real-world statistics about the existence of vampires.
Curated OER
Adventures With Maps And Globes
First graders examine the differences between a map and a globe. They discuss and identify the symbols on maps and globes, then in small groups complete a worksheet. Students then complete a Venn Diagram comparing maps and globes.
Curated OER
Smaller Than One
Sixth graders practice converting a fraction into a decimal and a percent. They explain relationships among rational numbers. They order and compare whole numbers, fractions (including mixed numbers), and decimals using a variety of...
Curated OER
Ye Olden Times And New
Students investigate the changes that occurred during the Industrial Revolution by comparing primary source documents from the Lewiston Evening Journal of 1895. They evaluate the document using a guided worksheet and discuss the changes...
Curated OER
The Good, The Bad, The Ugly
Sixth graders examine the causes of the stock market crash of 1929. In this integrated math/history unit on the stock market, 6th graders study, research, and read stocks, visit a local bank, and create a PowerPoint to show the...
Curated OER
Immigration Unit
Third graders develop an appreciate for the various cultures that are present in their local community. Through reading and research, they explain how various culture came to live in their area. At the conclusion of the unit, 3rd...
Curated OER
"Political Polls"
In this reading comprehension learning exercise, students, after reading a short article called "Political Polls," fill in a crossword puzzle utilizing the highlighted words from the article to answer the clues going across and down.
Curated OER
Historic Population Chart
Students examine the changes in the population in Idaho over a specific amount of time. In groups, they use the digital atlas to identify the trends in the population and describe why and how they exist. To end the lesson, they compare...
Curated OER
Government
Second graders run for various offices. They dress up like a politician, pretend to be running for an office, and tell the students why they should vote for him/her. They explain why it is necessary for a community to have a government
Curated OER
Fractions: Jewish Population of Europe during WWII
Students evaluate population maps and convert fractions to percentages. In this WWII lesson plan, students use statistics on the Holocaust to determine population loss and change. Students create their own math questions and answers...
Curated OER
Circumference of a Pumpkin
Fourth graders watch a video and find the circumference of a pumpkin. In this circumference lesson, 4th graders watch a video to help them find the circumference of their pumpkins. Students define the word circumference on their data...
Curated OER
Measurement
First graders listen to a read aloud of Linda Williams, The Little Old Lady Who Was Not Afraid of Anything" before discussing Halloween. They measure pumpkins using chains of paper clips to find their length and width. Once they open the...
Curated OER
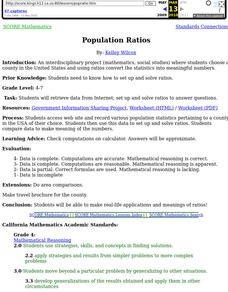
Population Ratios
Students access web site and record various population statistics pertaining to a county in the USA of their choice. They use this data to set up and solve ratios. They compare data to make meaning of the numbers.
Curated OER
Getting Out of the Box
Learners define stereotype, discrimination and prejudice. They brainstorm a social action plan to heal racism.
Curated OER
Birthday Party
Young scholars help plan a party for Q-Bear and think about some of the different ways people celebrate their birthdays. They then demonstrate knowledge and understanding of customs and traditions associated with participation in...
Curated OER
A Statistical Look at Jewish History
Students complete their examination over the Jewish Diaspora. Using population figures, they discover the importance of percentages in exploring trends. They use their own ethnic group and determine how it is represented in the United...


