Curated OER
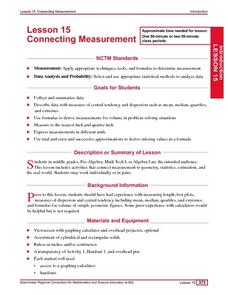
Connecting Measurement
Students participate in activities the connect measurement to geometry, statistics, estimation, and the real world. They collect measurements from their elbow to the tip of their middle finger and make a box plot of the data as well as...
Curated OER
Line Graphs and Commercial Costs
Young scholars investigate line graphs. In this middle school mathematics lesson, students compare and contrast different types of graphs and create line graphs based on the data provided.
Curated OER
How Far is Far?
Young scholars calculate the standard deviation of data. In this statistics lesson, students collect data, plot it and analyze it. They identify the mean, median and range of their data.
Curated OER
Consistent Circles
Students create a design of a circle. In this geometry lesson, students identify the measure of the diameter and radius of a circle. They graph and analyze their collected data and write equations based on direct variation.
Curated OER
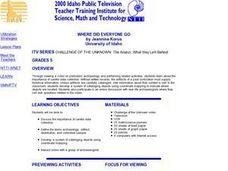
Where Did Everyone Go?
Fifth graders view a video, and perform related activities on prehistoric archaeology to gain an understanding about the importance of careful data collection. They develop a system of cataloging objects using coordinate mapping to...
Curated OER
Mathematical Magazines
Pupils classify and tabulate the type of advertisements found in a collection of magazines. Determination is made on what percent of the total number of ads each type represents. They present their results orally and in a graph.
Curated OER
Weather the Storm
Fourth graders complete multi-curricular activities for weather. In this weather lesson, 4th graders complete creative writing, research, and weather data analysis activities for the lesson.
Curated OER
Tiling a Patio
Fifth graders practice, with spreadsheets, to demonstrate how to determine the number of tiles needed to create a patio. They use pictures and gathered data to determine a pattern that can be used to solve problems. Students create a...
Curated OER
How Healthy is the Wetland?
Students explore wetlands. In this ecology lesson, students visit a wetland site and collect data about the wetland functions. Students record their results and use the data recorded to rate the wetland site on its function.
Curated OER
Schoolyard Tree Inventory and Biodiversity Project
Students investigate the trees in their schoolyard by collecting data. In this ecosystem lesson students examine the schoolyard in sections, tagging and numbering trees and shrubbery in the specific area. Students collect leaves for...
Curated OER
Get the Picture?
Pupils explore the movement to design low-cost solutions for the world's population and create a graph to represent the information. In this design and graphing lesson, students review the concepts of graphing and visit the Cooper-Hewitt...
Curated OER
Youth vs. Adult Employment
Students investigate the unemployment rate in Canada. In this statistics lesson, students collect data on youth finding jobs, graph and analyze the data. This assignment raises awareness of the employment problems in Canada.
Curated OER
The Kangaroo Conundrum: A Study of a Quadratic Function
Students play a game and collect data for their graph. In this algebra lesson, students solve quadratic equations and identify properties of their graph. They describe the pattern created by the graph and the game.
Curated OER
A Study of a Quadratic Function
Students factor and solve quadratic equations. In this algebra lesson, students play a game as the collect and graph data. they identify properties of their parabola and make predictions.
Curated OER
Census Sensibility
Students examine the importance of the census and census data collection methods. They gather statistical data, create graphs comparing state and national populations, and compose written reflections on why the census is necessary.
Curated OER
My Favorite Birthday
Pupils collect and organize data from classmates, display data on simple chart, and plan class birthday party.
Curated OER
Transportation Through Time
Third graders measure the speed at which they can walk in order to understand speed and distance traveled. They then research the history of transportation and express data in a class timeline.
Curated OER
Family Vacation
Young scholars use math to plan a trip by houseboat down the Mississippi River. They research and obtain information on the Mississippi River and its surroundings and use multiple graphs to represent their data.
Curated OER
Tallies Tell It All
Students explore data collection through the use of tally marks. After a demonstration of the use of tally marks students complete various inquires where they create a chart documenting the number of times a desired result happens. They...
Curated OER
How Does Your Plant Grow?
Students measure and record their height in centimeters on a graph. By integrating math and science, students collect data and apply graphing skills to the experiences they are having growing plants. Finally, students identify how to...
Curated OER
Apples A Peel To Me
First graders gather, record and interpret data. In this math lesson plan, 1st graders collect data from their classmates regarding their favorite types of apples. Students use the data collected to explore the use of real graphs and...
Curated OER
Statistics and Shopping
Students explore the concept of using consumer data and statistics to aid in the consumer decision making process. In this consumer data and statistics lesson plan, students research consumer data and statistics. Students analyze the...
Curated OER
If You Can’t Stand the Heat
Students design and build their own solar cooker. In this math lesson, students determine the relationship between the angles of the sun, reflection and cooking time of the solar cooker. They test their project, collect data and analyze...
Curated OER
Leap Frog Experiment
Second graders ask questions and design an experiment to explore different spinners in "The Leap Frog" board game. They conduct their experiment, collect information and interpret the results using a graph.
Other popular searches
- Data Collection
- Collecting Data
- Collecting and Recording Data
- Collect Data
- Data Collection Techniques
- Math Lessons Data Collection
- Data Collection Activity
- Data Sets Data Collection
- Data Collection and Median
- Data Collection and Graphs
- Data Collection Projects
- Data Collection and Analysis


