Curated OER
Let It Rain
Young scholars study the effects of water erosion on soil by gathering and analyzing data during an experiment. They decide on appropriate units of measurement to apply in problem solving.
Curated OER
Getting Data from a Table
In this addition and subtraction table worksheet, students practice deciphering which skill would best help them solve the equation. The tables help illustrate the problem.
Curated OER
How Much Data is That?
Students differentiate between exponential and logarithmic functions. In this algebra lesson, students use logarithmic properties to solve equations. They identify growth and decay of graphs.
Curated OER
String Of Lights
Young scholars collect, graph and analyze data. In this statistics lesson plan, students compare data using different types of graphs. They make predictions, draw conjectures as they analyze bulbs used in a holiday light set.
Curated OER
How Safe Is Your Backyard?
Seventh graders investigate the safety of soil and water locally and communicate via the Internet with students in different locales sharing information. They research the Internet using its multimedia capabilities and collate the data...
Curated OER
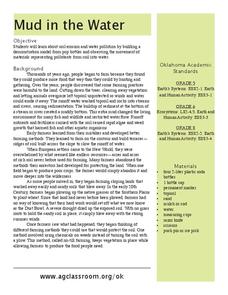
Mud in the Water
Sixth graders investigate erosion. In this erosion instructional activity, 6th graders explore how farming changes the environment. Students construct an erosion model and research ways to protect the soil from excess mud generated by...
Curated OER
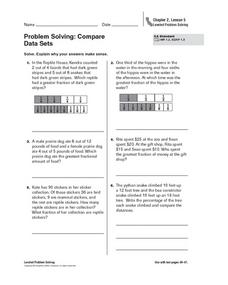
Problem Solving: Compare Data Sets
There are a variety of techniques students can use to compare fractions. For this worksheet on fractions, 5th graders are shown a way to create a visual comparison and asked to solve word problems. Students are encouraged to draw a...
Curated OER
Geometry Jeopardy
Students identify the pattern in a problem. In this geometry lesson, students make predictions, collect and analyze data. They apply the idea of scales and measurements to the real world.
Curated OER
Introduction to Graphical Representation of Data Sets in Connection with Nuclear Decay
Students record data, make observations, and share in experimentation and discussion of numerical experiments.
Curated OER
Surveys
Students collect data from middle school survery. They tabulate percentages by grade level. They create a graph to display the survey results.
Curated OER
What Would Make Our School More "Green"?
Students survey their school to get ideas for how to make the school more environmentally friendly. In this environmental lesson, students collect data from other students and teachers. They use the data to create graphs and present a...
Curated OER
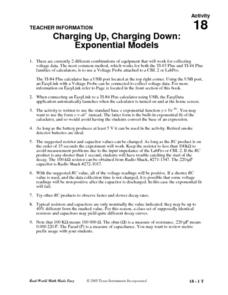
Charging Up, Charging Down
Learners collect and analyze voltage data. Then, they investigate exponential functions using the TI and a Voltage Probe and graph their data and analyze it using a table.
Curated OER
Mean Meadian and Mode
Students apply central tendencies to given data. In this statistics lesson, students calculate the mean, median, and mode as it relates to their data. They collect data and graph it while identifying the way the numbers are ordered.
Curated OER
Determining Mean, Range, Median, Mode, and Probability
Students calculate mean, median, range, mode and probability. Then, working in teams, they use data from their workplace to compute values for these terms. Finally the class explores the term "probability" using a die.
Curated OER
Shedding Light on the Weather with Relative Humidity
Learners study weather using a graphing calculator in this lesson. They collect data for temperature and relative humidity for every hour over a day from the newspaper, then place the data in their handheld calculator and examine it for...
Curated OER
The Big Hand Challenge
Students utilize a computer spreadsheet to record and analyze data. In this problem solving lesson, students compare their hand size to that of the principal. Students understand standard and nonstandard measurement.
Curated OER
Mathematical Explorations of the People’s Design Award
Students conduct surveys using nominees from the People’s Design Award, analyze data, and present the results using a pictorial representation. In this lesson, students will then design their own contest and mathematically determine a...
Curated OER
Go Fish!
Students collect data, interpret data summarize proportional reasoning. Students determine (with various alternate goods) the number of fish in a nearby pond. Students capture the goldfish crackers, deal with pretzels and then write...
Texas Instruments
Measure Up!
Statisticians take things to new heights using a set of height measurements. Students use TI-82 or TI-83 calculators to determine extreme values and the median for the data. They also construct a box-and-whisker plot to summarize the...
Curated OER
Endocrine Disruptors in Our Drinking Water: Should We Be Concerned?
Students investigate the different hormone contaminants in the water supply. In this math lesson plan, students analyze data tables and graphs. They demonstrate exponential growth and decay using frog populations.
Curated OER
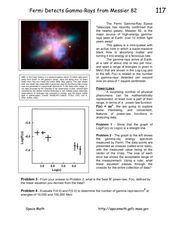
Fermi Detects Gamma-Rays from Messier
In this power law function worksheet, students use data from the Fermi Gamma-Ray Space telescope to apply the power law function to physical phenomena. Students use a graph to solve four problems.
Curated OER
Get a Half-Life!: Student Worksheet
In this math/science worksheet, students will work in pairs to conduct an experiment based on a decay function which is often used to model radioactive decay. Students will shake M & M's in a cup to rub off the M and then record...
EngageNY
Presenting a Summary of a Statistical Project
Based upon the statistics, this is what it means. The last lesson in a series of 22 has pupils present the findings from their statistical projects. The scholars discuss the four-step process used to complete the project of their...
Statistics Education Web
It Creeps. It Crawls. Watch Out For The Blob!
How do you find the area of an irregular shape? Class members calculate the area of an irregular shape by finding the area of a random sampling of the shape. Individuals then utilize a confidence interval to improve accuracy and use a...
Other popular searches
- Data Collection
- Collecting Data
- Collecting and Recording Data
- Collect Data
- Data Collection Techniques
- Math Lessons Data Collection
- Data Collection Activity
- Data Sets Data Collection
- Data Collection and Median
- Data Collection and Graphs
- Data Collection Projects
- Data Collection and Analysis


