Curated OER
Range, Cluster, Gap and Outliers
There are a number of activities here where learners collect and record data, as well as, activities where the likelihood of an event happening is calculated given the experimental probability. Young statisticians organize information...
Curated OER
Calculating Theoretical & Experimental Probability
Students collect data by conducting a survey of fellow classmates. They investigate the relationship between estimates obtained from samples and theoretical probabilities. Answer keys included.
Beyond Benign
Can You Hear Me Now? Cell Phone Accounts
How sustainable are cell phones? Throughout the unit, learners explore the issues around cell phones concerning sustainability. Class members take a graphical look at the number of cell phones across the world using a box-and-whisker...
Curated OER
Weather, Data, Graphs and Maps
Students collect data on the weather, graph and analyze it. In this algebra lesson, students interpret maps and are able to better plan their days based on the weather reading. They make predictions based on the type of clouds they see.
Curated OER
Graph It!
There is more than one way to represent data! Learners explore ways to represent data. They examine stacked graphs, histograms, and line plots. They conduct surveys and use stacked graphs, histograms, or line plots to chart the data they...
Curated OER
Starting With Stats
Statisticians analyze a data set of student IQs by finding measures of central tendency and dispersion such as mean, median, mode, and quartiles. They practice using a graphing calculator to find the values and analyze box plots and...
Curated OER
Teaching with Collections
Students examine collections. In these real-world collections lessons, students examine and describe buttons and shells. Students will then sort, classify, and graph items according to various indicated descriptors.
Curated OER
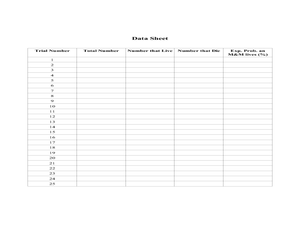
The M & M Function
In this M & M worksheet, students perform probability experiments. They collect and interpret data, identify the exponential function describing the data and create graphs from the collected information. This one-page worksheet...
Achieve
False Positives
The test may say you have cancer, but sometimes the test is wrong. The provided task asks learners to analyze cancer statistics for a fictitious town. Given the rate of false positives, they interpret the meaning of this value in the...
Curated OER
Probability and Statistics
Students are taught to search the internet for statistics concepts on sports. In this probability lesson, students collect data and use the calculator to graph and analyze their data. They graph and make predictions about sports using...
Curated OER
Play It
There are a number of activities here that look at representing data in different ways. One activity, has young data analysts conduct a class survey regarding a new radio station, summarize a data set, and use central tendencies to...
Curated OER
Box Plots
Young statisticians are introduced to box plots and quartiles. They use an activity and discussion with supplemental exercises to help them explore how data can be graphically represented.
Shodor Education Foundation
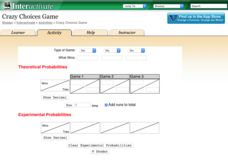
Crazy Choices Game
Wanna take a chance on which game is best? The resource provides three games of chance using multiple types of games. Games range from coin toss to cards. Choosing a type of game, pupils determine what wins and enter the theoretical...
Curated OER
Mean Meadian and Mode
Learners apply central tendencies to given data. In this statistics lesson, students calculate the mean, median, and mode as it relates to their data. They collect data and graph it while identifying the way the numbers are ordered.
Radford University
A Change in the Weather
Explore the power of mathematics through this two-week statistics unit. Pupils learn about several climate-related issues and complete surveys that communicate their perceptions. They graph both univariate and bivariate data and use...
Curated OER
Indy 500
Start your engines! Small groups collect data from websites pertaining to the Indianapolis 500 in order to determine average speed per lap and miles in each lap. The lesson requires prior knowledge of the the formula d=rt.
Curated OER
RIP M&M's
Students solve theoretical probability problems. In this algebra lesson, students apply the concept of probabilities to solving real life scenarios. They collect data and graph it using experimental probability.
Curated OER
Traveling Through the Solar System
Students use calculator and non-calculator methods for analyzing data. They apply data collection and analysis in a study of mass and weight. Students enhance and apply the concept of line of best fit. They master graphing in a plane,...
Curated OER
Ashes to Ashes: Using Evaporation Rate to Identify an Unknown Liquid
Learners explore the concept of evaporation rates in this evaporation rates lesson plan. They will try to identify the chemical that began a fire, perform an experiment where they use the evaporation rates to determine the unknown...
American Statistical Association
How Tall and How Many?
Is there a relationship between height and the number of siblings? Classmates collect data on their heights and numbers of brothers and sisters. They apply statistical methods to determine if such a relationship exists.
Intel
What Does This Graph Tell You?
What can math say about natural phenomena? The fifth STEM lesson in this project-based learning series asks collaborative groups to choose a phenomenon of interest and design an experiment to simulate the phenomenon. After collecting...
Curated OER
Linear Regression and Correlation
Learners explore scatter plots. In this linear regression lesson, groups of pupils graph scatter plots and then find the line of best fit. They identify outliers and explain the correlation. Each group summarizes and shares their...
Bowland
Crash Test
Use mathematics and simulations to investigate car crashes. IScholars test hypotheses involving car crashes. They collect, analyze, and display data from computer simulations to support or refute their hypotheses.
Curated OER
Matchstick Math: Using Manipulatives to Model Linear, Quadratic, and Exponential Functions
Playing with matches (unlit, of course) becomes an engaging learning experience in this fun instructional unit. Teach pupils how to apply properties of exponential functions to solve problems. They differentiate between quadratic and...


