Other
Link to Learning: Data Management and Probability
Link to Learning is a site popular among Ontario teachers. This collection of sites addresses Data Management and Probability expectations in the Ontario Math curriculum for Kindergarten to Grade 8.
Other
Link to Learning: Data Management and Probability
Link to Learning is a site popular among Ontario teachers. This collection of sites addresses Data Management and Probability expectations in the Ontario Math curriculum for Kindergarten to Grade 8.
Sophia Learning
Sophia: Continuous Data Tutorial
Continuous data is defined and explained in this video.
Sophia Learning
Sophia: Continuous Data
Continuous data is defined and examples are given in this lesson.
Sophia Learning
Sophia: Discrete Data
Explore the term discrete data and look at examples for further explanation.
City University of New York
Scientific Method and Probability: Interactive Activity
This interactive lesson begins with the basics and carries through to methods of data analysis, all interactively. Supporting material is excellent.
Education Development Center
Math Partners: Statistics and Probability [Pdf]
Comprehensive unit that consists of lessons and activities designed to help students learn statistics and probability concepts.
PBS
Pbs Lesson Plan: Chances Are Talking Probability (Pdf) [Pdf]
An introductory lesson in probability for students in grades three to five. The concepts presented in this lesson are interwoven, over time, into a current unit of study. Students examine closely the "language" of probability as used in...
Texas Instruments
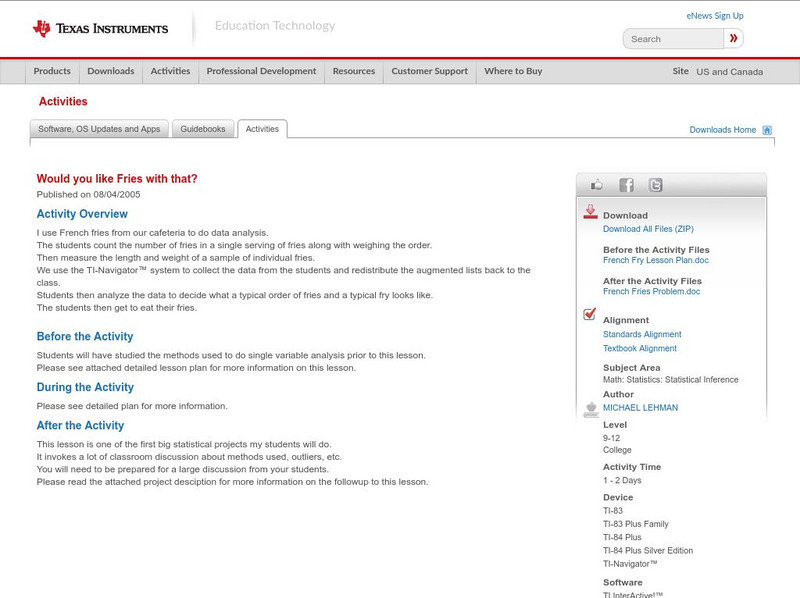
Texas Instruments: Would You Like Fries With That?
French fries from your cafeteria to do data analysis. The students count the number of fries in a single serving of fries along with weighing the order, then measure the length and weight of a sample of individual fries. You then use the...
Texas Instruments
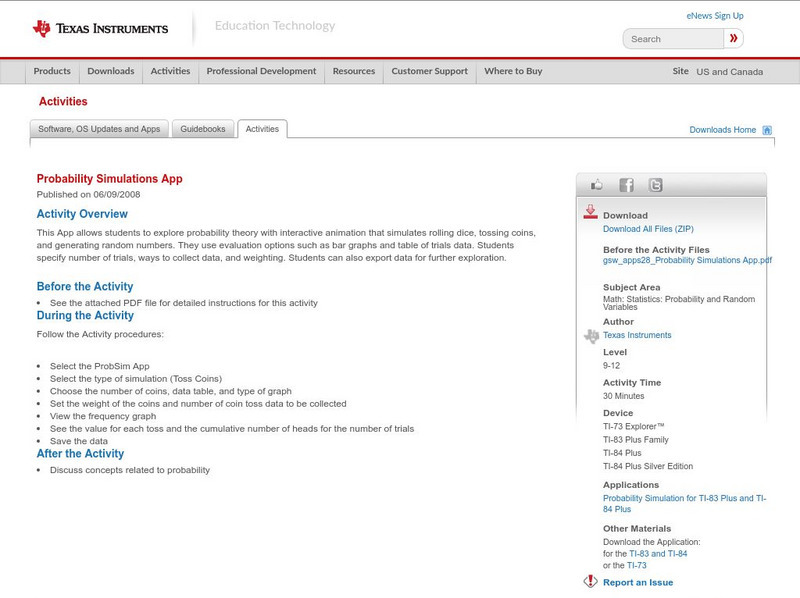
Texas Instruments: Probability Simulations App
This App allows students to explore probability theory with interactive animation that simulates rolling dice, tossing coins, and generating random numbers. They use evaluation options such as bar graphs and table of trials data....
Rice University
Hyper Stat Online Statistics Textbook
Many people cringe at the idea of studying statistics, but it doesn't have to be impossible! David M. Lane, Associate Professor of Psychology, Statistics, and Management at Rice University, offers a large collection of resources for the...
Texas Instruments
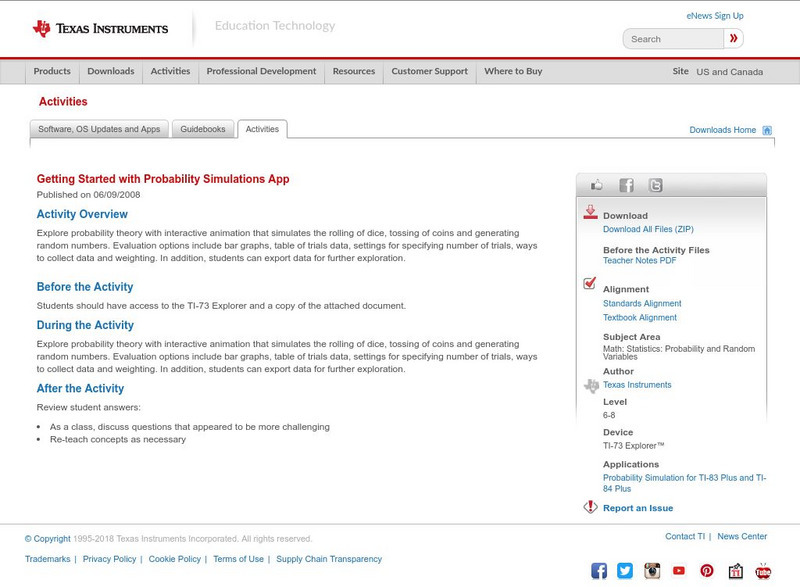
Texas Instruments: Getting Started With Probability Simulations App
Explore probability theory with interactive animation that simulates the rolling of dice, tossing of coins and generating random numbers. Evaluation options include bar graphs, table of trials data, settings for specifying the number of...
Other
Stat Soft: Statistics Glossary
Dozens of statistical terms are defined and illustrated in this glossary.
Teachnology
Teachnology: Teacher Guide to Probability and Statistics
Statistics Theme provides a collection of free sample worksheets, teacher resources, lesson plans and interactive media for grades k-12.
TED Talks
Ted: Ted Ed: Hans Rosling Shows the Best Stats You've Ever Seen
Explore collected data in regards to life expectancies, family size, and finances through out the world and the various ways the data has been displayed.
Beacon Learning Center
Beacon Learning Center: Leap Frog Experiment
Students design an experiment, collect information using tree diagrams, and interpret the results using charts in this interactive web lesson.
National Council of Teachers of Mathematics
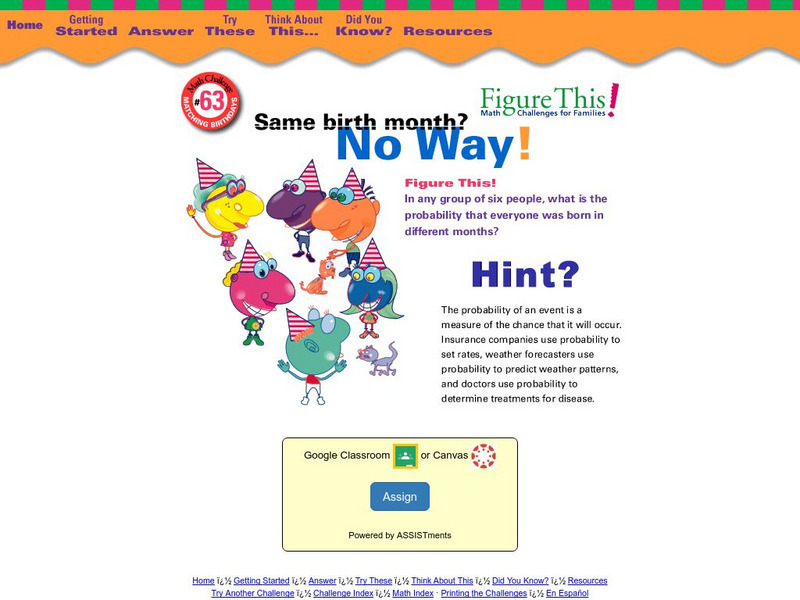
Nctm: Figure This: Matching Birth Months
Here's a interesting challenge! Out of six people in a room, what is the probability that everyone was born in a different month? An investigation that explores the probability of an event occurring. Discover how this skill is used in...
National Council of Teachers of Mathematics
Nctm: Figure This: Math Challenges for Families
Students, teachers, and parents alike will enjoy this challenging math site. It contains a clever brain teaser section plus creative problems related to algebra, geometry, measurement, numbers, statistics, and probability. A Spanish...
Microsoft
Microsoft Education Lesson Plan: Candy Is Dandy
Explore color distribution of M&M candies using this detailed lesson plan. An engaging integrated lesson that requires understanding of spreadsheets and formulas, and logical reasoning. Links to related websites.
Other
Laus Dnet: Grade 5 Excel Lesson Plan
In this online instructional activity, students will survey students in their school to determine their favorite type of hand-held ice cream. Before performing the survey, students will make predictions about which ice creams they think...
Alabama Learning Exchange
Alex: Beep! Beep! Move Over! I Am Going to Be Late!
During this lesson, students will investigate how to "clear up" the "Traffic Jam." They will be using large manipulatives (their bodies), small manipulatives (carpet squares), and technology (the Java applet) to find the relationship...
Texas Instruments
Texas Instruments: Hurricane Hunters: Tracking Katrina and Rita
In this activity students can use data collected on Hurricanes Katrina and Rita to study functions, predictions, and probability models. Students will track the two hurricanes to see how the paths of the hurricanes affected the Gulf...
Other
Statistics Education Web: Bubble Trouble [Pdf]
Use random sampling to formulate, collect, and compare data from two populations. Written by Peter Banwarth of Oregon State University.
Khan Academy
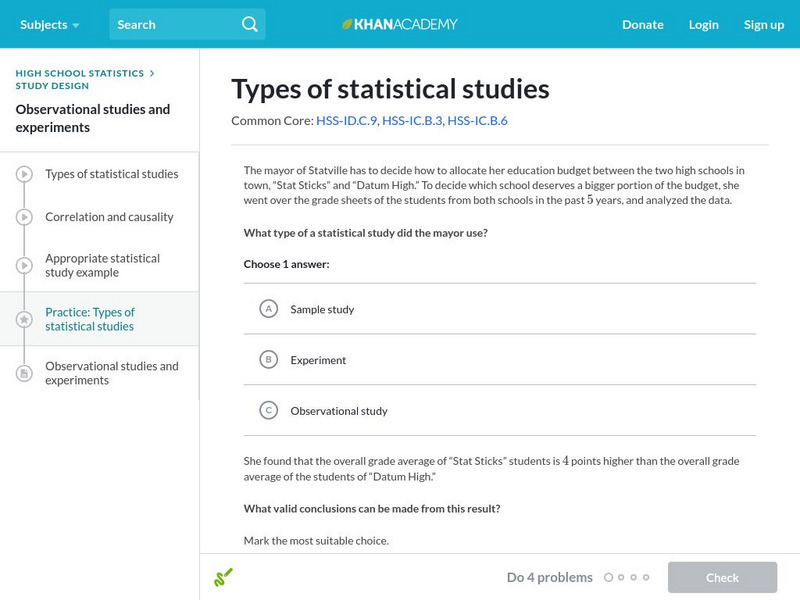
Khan Academy: Types of Statistical Studies
Determine if a statistical study is a sample study, an experiment, or an observational study. Students receive immediate feedback and have the opportunity to try questions repeatedly, watch a video or receive hints.




![Math Partners: Statistics and Probability [Pdf] Unit Plan Math Partners: Statistics and Probability [Pdf] Unit Plan](https://d15y2dacu3jp90.cloudfront.net/images/attachment_defaults/resource/large/FPO-knovation.png)






![Statistics Education Web: Bubble Trouble [Pdf] Lesson Plan Statistics Education Web: Bubble Trouble [Pdf] Lesson Plan](https://content.lessonplanet.com/knovation/original/715465-988c4be74f96df36c2d9bcb6f2f5182f.jpg?1661829195)
