Hi, what do you want to do?
Willow Tree
Scatterplots and Stem-and-Leaf Plots
Is there a correlation between the number of cats you own and your age? Use a scatter plot to analyze these correlation questions. Learners plot data and look for positive, negative, or no correlation, then create stem-and-leaf plots to...
Teach Engineering
Where Are the Plastics Near Me? (Mapping the Data)
The last activity in a nine-part series has teams create a Google Earth map using the data they collected during a field trip. Using the map, groups analyze the results and make adjustments to the map to reflect their analysis. A short...
Willow Tree
Line Plots
You can't see patterns in a jumble of numbers ... so organize them! Learners take a set of data and use a line plot to organize the numbers. From the line plot, they find minimum, maximum, mean, and make other conclusions about the...
Willow Tree
Histograms and Venn Diagrams
There are many different options for graphing data, which can be overwhelming even for experienced mathematcians. This time, the focus is on histograms and Venn diagrams that highlight the frequency of a range of data and overlap of...
Willow Tree
Bar Graphs
Circles, lines, dots, boxes: graphs come in all shapes in sizes. Scholars learn how to make a bar graph using univariate data. They also analyze data using those bar graphs.
Teach Engineering
Searching for Bigfoot and Others Like Him
Individuals create a GIS data layer in Google Earth that displays information about where one might find seven different cryptids. The class members research to find data on cryptid sightings they can include in their data...
Laboratory for Atmospheric and Space Physics
The Planets and Scale
Scholars gain an insight into the relative size of planets and distance between inner and outer planets with the help of informational text, a data table, and a series of four questions.
Center for Learning in Action
Density
Explore the concept of density within states of matter—gases, liquids, and solids—through a group experiment in which young scientists test objects' texture, color, weight, size, and ability to sink or float.
University of Georgia
Would Your Cat Eat This Stuff?
Processed foods use inorganic compounds for flavoring and preservation. This take-home laboratory challenges scholars to find 20 different compounds identified on the labels of foods to list on their data collection sheet. The activity...
Granite School District
Kindergarten CCSS Math Vocabulary Word List
Help kindergartners develop the academic language they need to master the Common Core standards with this list of math vocabulary. Including the definitions of each term as well as a set of word cards with supporting images and examples,...
Chemical Education Foundation
Teacher's Guide to Science Projects
Do you find the idea of having a science fair with all of your students intimidating? Use a guide that provides everything you need to know to make project-based learning manageable. The resource includes options for four...
Virginia Department of Education
How Much is that Tune?
Tune in for savings! Scholars investigate pricing schemes for two different online music download sites. After comparing the two, they determine the numbers of songs for which each site would be cheaper.
Other
Stat Soft: Statistics Glossary
Dozens of statistical terms are defined and illustrated in this glossary.
Other
Stat Soft: Getting Started With Statistics Concepts
Definitions of the basic concepts in statistics. Great for review and discussion or for introduction into topics.
Math Is Fun
Math Is Fun: How to Do a Survey
A clear explanation of how to plan and conduct a survey, then tabulate and display your results.
Rice University
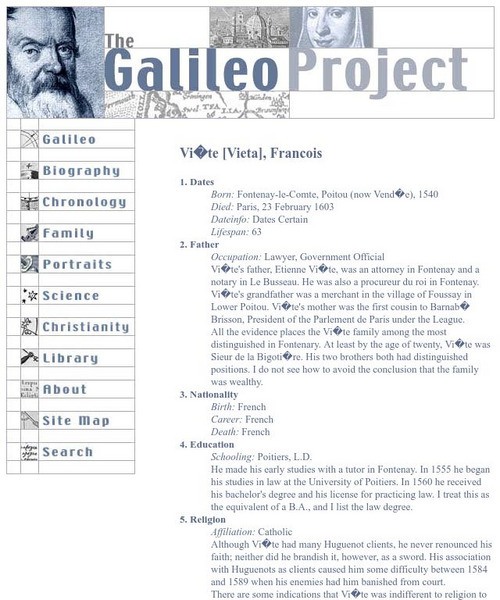
Galileo Project: Francois Viete
This site from The Galileo Project of Rice University provides a brief overview of Francois Viete, displayed as ten biographical topics. The fields of data collected include topics such as birth/death dates, father, nationality,...


