Hi, what do you want to do?
National Center for Ecological Analysis and Synthesis, University of California Santa Barbara
Kids Do Ecology: Data and Science
Learn about conducting your own investigation with these tips on following the scientific method. Find out how to state hypothesis, make observations, collect and analyze data, and display data to share results and conclusions of your...
Other
Ocean Tracks: Fact or Artifact? Interpreting Patterns in Ocean Tracks Data [Pdf]
Ever wonder where marine animals go? How fast they swim? How deep they dive? Electronic tagging has opened a new window into the world of the open ocean. Ocean Tracks gives you access to data collected by tags on real live migrating...
CK-12 Foundation
Ck 12: Statistics: Displaying by Type of Data Grade 7
[Free Registration/Login may be required to access all resource tools.] Collect, organize and display data collected from real-world surveys.
University of Cambridge
University of Cambridge: Maths and Sports: Our Sports
What events are there in your school sports day, and in the Olympic Games? What are your favourite races and sports? This activity encourages discussion and decisions about how to collect and display data, and is designed to be...
Texas Education Agency
Texas Gateway: Selecting and Using Representations for Collected Data
[Accessible by TX Educators. Free Registration/Login Required] Given a variety of data (including line plots, line graphs, stem and leaf plots, circle graphs, bar graphs, box and whisker plots, histograms, and Venn diagrams), the student...
US Environmental Protection Agency
Epa: Air Data
The AirData website gives you access to air quality data collected at outdoor monitors across the United States, Puerto Rico, and the U. S. Virgin Islands. The data comes primarily from the AQS (Air Quality System) database. You can...
Louisiana Department of Education
Louisiana Doe: Louisiana Believes: Eureka Math Parent Guide: Collecting and Displaying Data
A guide to support parents as they work with their students in collecting and displaying data.
McGraw Hill
Glencoe: Collecting and Analyzing Data Quiz
This site is a quiz with five quick questions to check your understanding of how to collect and analyze data. It is self checking.
PBS
Pbs Mathline: Button, Button Lesson Plan [Pdf]
An integrated math and language arts lesson focusing on statistics. Students explore the concepts of estimation, data collection, data analysis, classification, graphing, and counting through the reading of the Button Box by Margarette...
Better Lesson
Better Lesson: Graph Party
First graders will be involved in creating three different types of graphs and then be asked to answer questions about each representations data set.
Math Is Fun
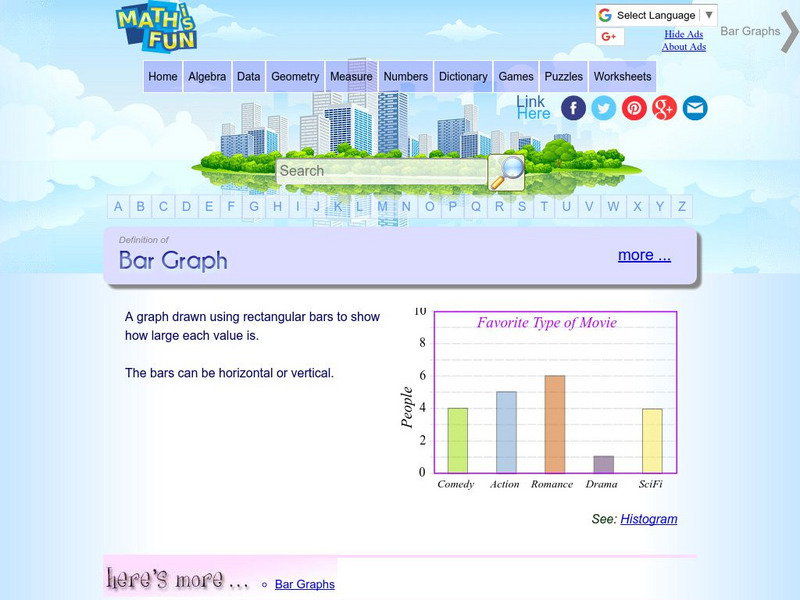
Math Is Fun: Definition of Bar Graph
Get the definition for a bar graph. Then, select the link "here's more" and use the interactive graph to display data as a bar graph, line graph or pie chart. The finished graph may be printed.
Texas Instruments
Texas Instruments: Glencoe Middle School Science: Biodiversity and Ecosystems
Students will conduct a field investigation to learn about the environment. They will observe biotic and abiotic factors of an ecosystem. Students can use the CBL 2 and a temperature probe to collect data and a graphing calculator to...
Other
Stat Soft: Statistics Glossary
Dozens of statistical terms are defined and illustrated in this glossary.
Scholastic
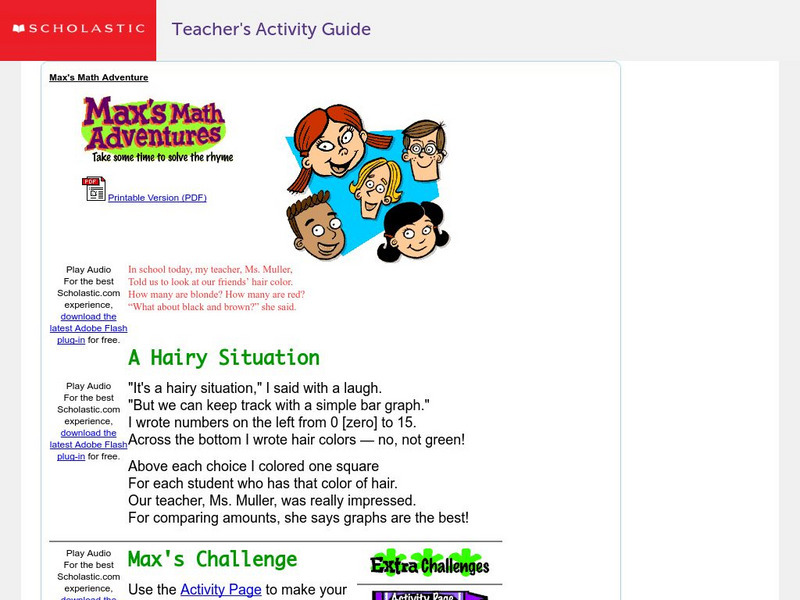
Scholastic: Max's Math Adventures: A Hairy Situation
Help Max make a bar graph to show the hair colors of his classmates. Teachers will appreciate the activities with bar graphs in the extra challenges. Use the teacher's guide to create a fun and engaging lesson.
Alabama Learning Exchange
Alex: Who Bounces Best?
This is a cooperative learning, kinesthetic and presentation lesson. Students will use the computer to create graphs/charts to display data collected by counting the number of successful bounces when bouncing a basketball for 30 seconds....
TED Talks
Ted: Ted Ed: Hans Rosling Shows the Best Stats You've Ever Seen
Explore collected data in regards to life expectancies, family size, and finances through out the world and the various ways the data has been displayed.
Better Lesson
Better Lesson: 100 Students Project: Analyzing Survey Results
Sixth graders work in groups to analyze the survey data and plan their presentations for the 100 Students Project.
US Department of Education
Nces Kids: Creating an Area Graph
This is where you will find step by step directions explaining how to create an area graph. Complete each step and click on the next tab. Directions are simple and clear.
TeachEngineering
Teach Engineering: Spectroscopy
Students learn how using a spectrograph helps us understand the composition of light sources. Using simple materials and holographic diffraction gratings (available online at a variety of sites, including Edmund Scientifics and the...
Other
Gapminder: Unveiling the Beauty of Statistics for a Fact Based World View
Gapminder collects hundreds of statistics related to global economic, health, and social development and analyzes the relationships between them across different countries and time (a few indicators go back to 1800).
Alabama Learning Exchange
Alex: Get on Your Mark, Get Set, Go!
In collaborative/cooperative groups, students will review basic vocabulary and concepts for data and statistics. Students will create, collect, display, and interpret data in the form of frequency tables, bar graphs and circle graphs.
Math Is Fun
Math Is Fun: How to Do a Survey
A clear explanation of how to plan and conduct a survey, then tabulate and display your results.
Other
Classzone: Weather Forecasters Use Advanced Technologies [Pdf]
An excerpt from an earth science textbook. The chapter shown here covers concepts about how weather data is collected, displayed and how meteorologists forecast fronts and storms.


![Ocean Tracks: Fact or Artifact? Interpreting Patterns in Ocean Tracks Data [Pdf] Lesson Plan Ocean Tracks: Fact or Artifact? Interpreting Patterns in Ocean Tracks Data [Pdf] Lesson Plan](https://static.lp.lexp.cloud/images/attachment_defaults/resource/large/FPO-knovation.png)


