Benjamin Franklin High School
Saxon Math: Algebra 2 (Section 1)
This first of twelve algebra 2 resources provides a broad review of many algebra 1 concepts through a number of separable lessons and labs. Starting with the real number system and its subsystems, the sections quickly but thoroughly move...
Curated OER
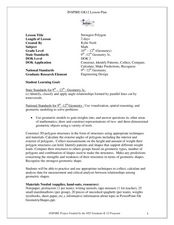
Strongest Polygon
Pupils define and identify shapes by name. In this geometry lesson, students construct, identify and compare polygons based on the number of sides. They classify each shape based on their angle sum theorem.
Curated OER
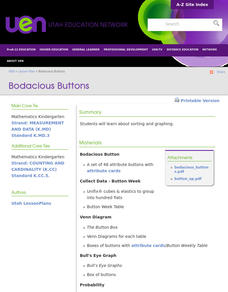
Bodacious Buttons
First graders participate in games, graphing, and probability exercises to sort and graph buttons. They sort buttons with Venn diagrams and Bull's Eye graphs.
Curated OER
Mathematical Magazines
Pupils classify and tabulate the type of advertisements found in a collection of magazines. Determination is made on what percent of the total number of ads each type represents. They present their results orally and in a graph.
Curated OER
Statistics and Shopping
Students explore the concept of using consumer data and statistics to aid in the consumer decision making process. In this consumer data and statistics lesson plan, students research consumer data and statistics. Students analyze the...
Curated OER
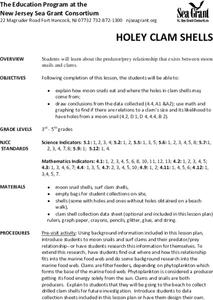
Holey Clamshells
Students analyze data to make hypotheses and conclusions regarding the predator/prey relationship between moon snail and surf clams.
Curated OER
My Favorite Birthday
Pupils collect and organize data from classmates, display data on simple chart, and plan class birthday party.
Curated OER
Tallies Tell It All
Students explore data collection through the use of tally marks. After a demonstration of the use of tally marks students complete various inquires where they create a chart documenting the number of times a desired result happens. They...
Curated OER
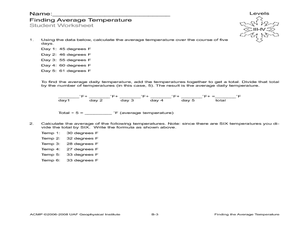
Finding the Average Temperature
Students calculate averages. In this average temperature lesson, students collect data and use their problem solving skills to calculate average temperatures.
Curated OER
Weather Report Chart
Young scholars complete a weather report chart after studying weather patterns for a period of time. In this weather report lesson, students measure temperature, precipitation, cloud cover, wind speed, and wind direction for a month....
Curated OER
Direct and Inverse Variation
Eighth graders participate in two data collection activities that involve direct and inverse variation. In the pre-assessment, 8th graders categorize numerical, graphical, and verbal representations as linear or nonlinear and determine...
Curated OER
Ecology - Biodiversity Lab
Studnents examine the degree of biodiversity that exists in one's everyday environment, in order to develop an understanding of how scientists classify organisms and to explain why biodiversity is important for living things.
Curated OER
The Box Problem
Students create graphic, algebraic and verbal ideas of functions. In this algebra lesson, students graph functions and identify the zeros of the functions. They find the domain and range and classify functions as relation or not.
Curated OER
Candy is Dandy
Students investigate color distribution in bags of M&Ms They sort and classify the contents of a bag of M&Ms and summarize their findings on a worksheet. Students convert the numbers into charts and make predictions about color...
Curated OER
Geometry Jeopardy
Students identify the pattern in a problem. In this geometry lesson, students make predictions, collect and analyze data. They apply the idea of scales and measurements to the real world.
Curated OER
Making Parallel Lines
Students differentiate between parallel and perpendicular lines. In this geometry lesson, students make conjectures and apply it to solve real life situations. They collect data and make predictions based on the data.
Curated OER
Introduction to Bar Graphs Lesson Plan
Students organize and interpret data using bar graphs.
Curated OER
CSI Clamshell Investigation
Students explore predator/prey relationships. They research information on moon snails and claims. Students draw conclusions from the data collected. They use math and graphing to determine if there is a relationship to the clam's size...
Curated OER
3-D Beginning Graphs
Students explore the concept of big and small. They collect objects from the classroom, sort them by size, and create a graph using Duplo stacking blocks.
Curated OER
Trash on Texas Beaches
Students take a field trip to a local Texas beach. Using the trash and debris they find, they classify them based on specific criteria. In groups, they calculate the total for each category and determine the percentage of each category...
Curated OER
Nuts & Bolts: is Classification, Arbitrary, Or Not?
Students, in groups, classify furniture, share their categories and rationales, then note how their different schemes vary, perfectly logical and useful, but completely arbitrary.
Curated OER
Checking County Numbers
Students use their county's information page to gather information about their community. Using the information, they create graphs from the tables provided and interpret the data. They write a paragraph showing their interpretation of...
Curated OER
Let's Clean the Beach!
Students volunteer their time to clean a local park. They estimate the amount of debris they collect and make observations. They write a poem and draw an illustration about their experience.
Curated OER
Sink or Float?
Pupils predict and explore to discover which objects sink or float in fresh and salt water, predict how salt affect objects, write predictions on T chart, discuss difference between man-made and natural waters, and graph results.


