US Department of Education
National Center for Education Statistics: Create a Graph Tutorial
This tutorial walks students through how to create different types of graphs using the Create a Graph tool available on the website. Covers bar graphs, line graphs, pie charts, area graphs, scatter plots, and dependent and independent...
Paul Dawkins
Paul's Online Notes: Algebra: Circles
Detailed math tutorial features notes and examples that illustrate graphing circles.
Better Lesson
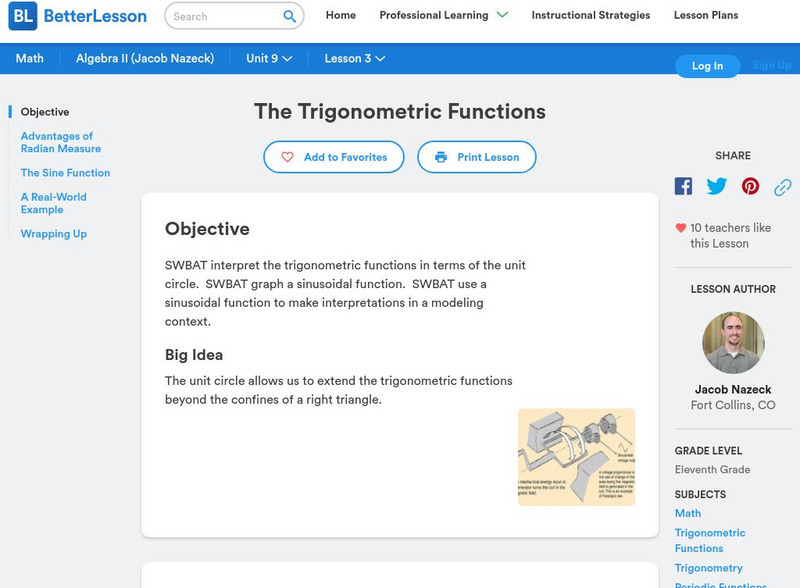
Better Lesson: Algebra Ii: The Trigonometric Functions
A lesson plan where students will interpret the trigonometric functions in terms of the unit circle, graph a sinusoidal function, and use a sinusoidal function to make interpretations in a modeling context.
Illustrative Mathematics
Illustrative Mathematics: F Tf Trig Functions and the Unit Circle
The purpose of this task is to help students make the connection between the graphs of sin t and cos t and the x and y coordinates of points moving around the unit circle. Students have to match coordinates of points on the graph with...
CK-12 Foundation
Ck 12: Algebra Ii: 4.2 Right Triangle Trig Extended to Circles With a Model
This section explores the relationship between right triangles, circles, and trigonometry. It investigates how a right triangle that is set inside a circle and rotates around the circle is connected to trigonometric functions and their...
CK-12 Foundation
Ck 12: Algebra Ii: 4.5 Graphing Sine and Cosine
This section explores the graphs of sine and cosine functions. It investigates how these graphs are related to coordinates for different angles in a unit circle.
Clark University
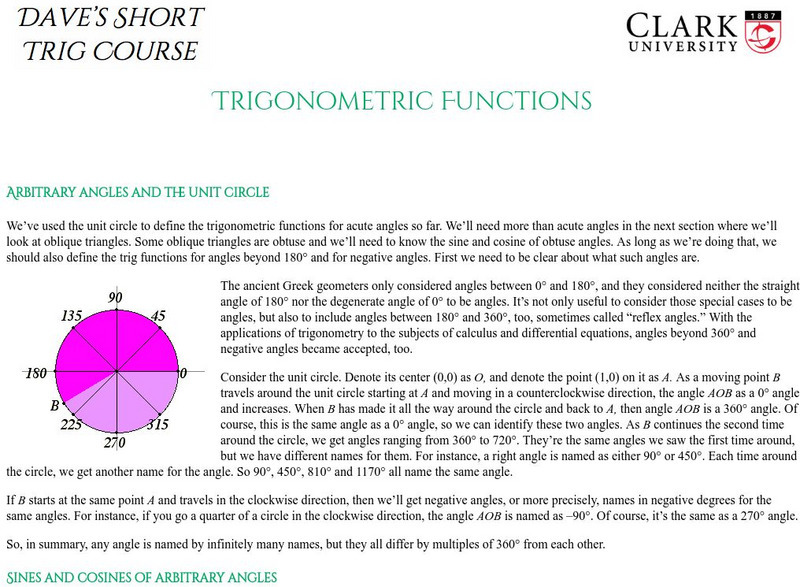
Clark University: Dave's Short Trig Course: Trigonometric Functions
The Clark University site shows and explains the graphs of the six trigonometric functions. It explains how to find an arbitrary angle measurement using trig. Also, it explains that sine and cosine functions are complementary.
Texas Instruments
Texas Instruments: Exploring Geometric Probability Using Ti Navigator
In this activity students will contribute a set of random points to a graph of a circle of radius 1 inscribed in a square. They will estimate the area of the circle using geometric probability.
Illustrative Mathematics
Illustrative Mathematics: F if Model Airplane Acrobatics
In this task, a model airplane pilot is practicing flying her airplane in a big loop for an upcoming competition. The task could serve as an introduction to periodic functions and as a lead-in to sinusoidal functions. By visualizing the...
Physics Classroom
The Physics Classroom: Energy Relationships for Satellites
The orbits of satellites are described and an energy analysis is performed. Kinetic, potential and total mechanical energy are explained and applied to the motion of satellites.
Other
Ctte: Geometer's Sketch Pad Activities
This site offers numerous activities for middle school and high school students to explore using Geometer's Sketch Pad.
Other popular searches
- Percent Circle Graph
- Circle Graph Worksheet
- Circle Graph Template
- Interpreting Circle Graphs
- Circle Graph Protractor
- Circle Graph Activity
- Reading Circle Graphs
- Circle Graphs Pie Charts
- Circle Graph Central Angle
- Bar and Circle Graphs
- Circle Graph in Excel
- Family Budget Circle Graph


