Hi, what do you want to do?
Wolfram Research
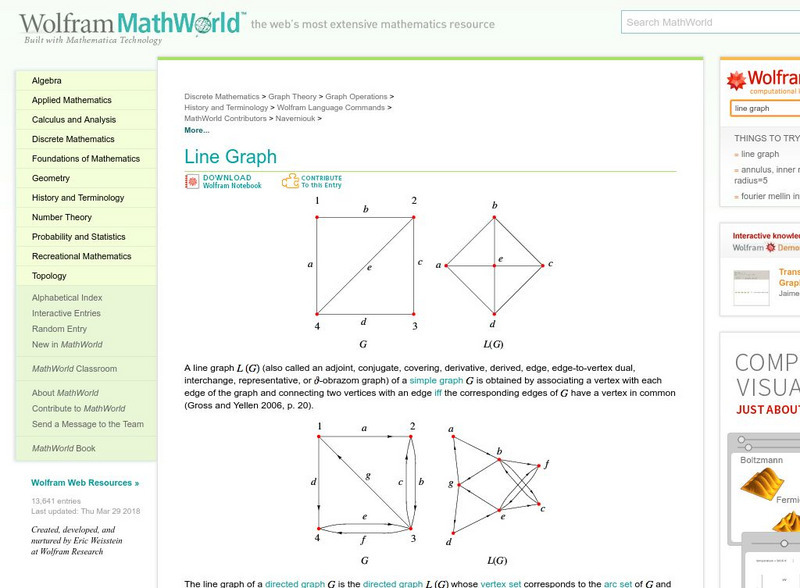
Wolfram Math World: Line Graph
Definition of a line graph with a variety of examples. Includes maps, charts, and detailed explanations for understanding.
Other
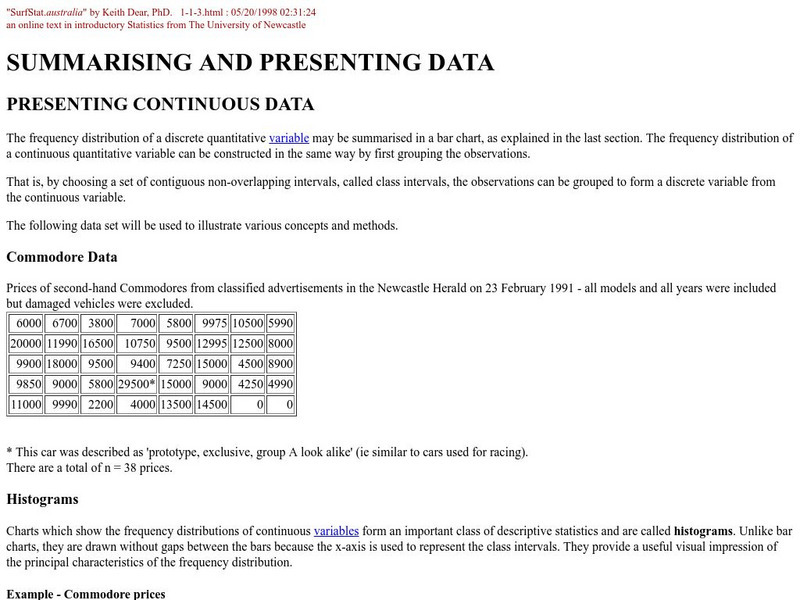
Grinnell College: Histograms Area of Rectangles
A sample problem is provided to help you create a histogram using a frequency distribution chart. Sample charts and formulas are provided to help explain how to find the area of the rectangles in the histogram and how to interpret what...
Texas A&M University
Texas A&m University: Moments of Inertia
This site is from the Math department of the Texas A&M University and contains wonderful information on Centers of mass and moments of inertia. Pictures, charts, graphs along with great text is all included.


