Other
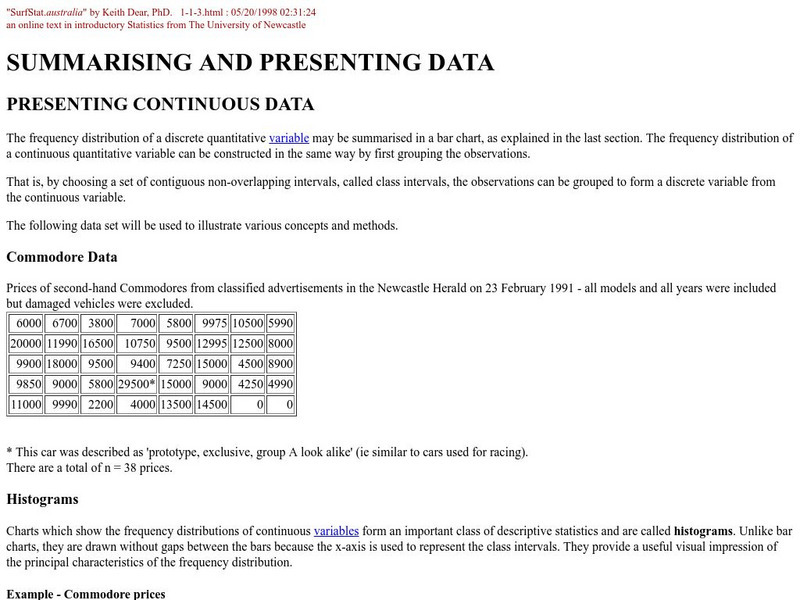
Grinnell College: Histograms Area of Rectangles
A sample problem is provided to help you create a histogram using a frequency distribution chart. Sample charts and formulas are provided to help explain how to find the area of the rectangles in the histogram and how to interpret what...
Science Education Resource Center at Carleton College
Serc: Inquiry: How Herbs Change Based on Growing Conditions
In this activity, students will develop writing, math, and inquiry skills by investigating the taste of basil. Students will test basil in different growing conditions while also comparing it to a controlled variable. Students will then...
Math Medics
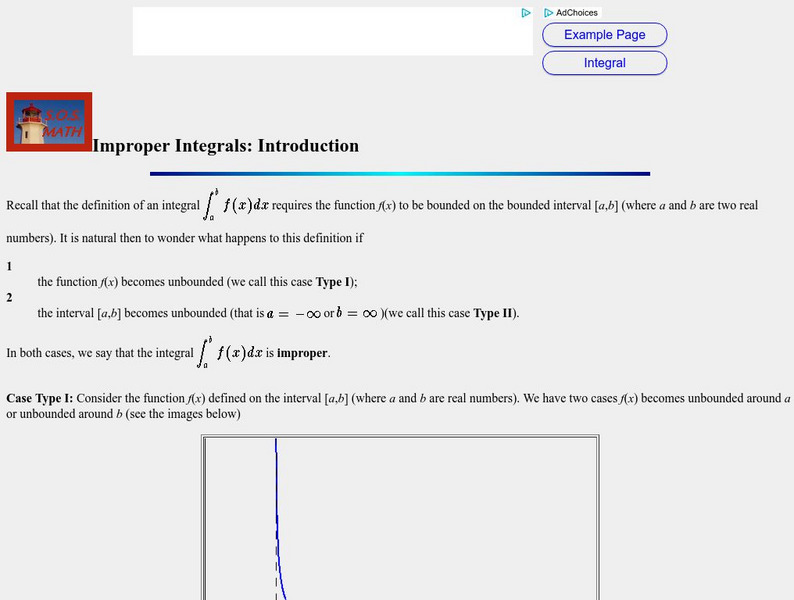
S.o.s. Math: Improper Integrals: Introduction
A detailed and comprehensive lesson explaining improper integrals. It contains many graphs and charts.
PBS
Pbs Learning Media: Peg + Cat Collection
The Peg + Cat on-air series and online resources provide many opportunities for educators to introduce or reinforce early math concepts. In each 11-minute on-air episode of this animated, math-based series for 3-8 year olds, Peg and Cat...
ClassFlow
Class Flow: Daily Opening
[Free Registration/Login Required] This flipchart builds math skills (calendar, counting, place value, money and charts) into the daily morning routine.
Texas A&M University
Texas A&m University: Moments of Inertia
This site is from the Math department of the Texas A&M University and contains wonderful information on Centers of mass and moments of inertia. Pictures, charts, graphs along with great text is all included.
PBS
Pbs Kids Afterschool Adventure!: Operation: Martha's Stem Stories Activity Plan
Welcome to Martha's STEM Stories! STEM stands for science, technology, engineering, and mathematics. You may already know that doing STEM means testing ideas, collecting data, making calculations, and drawing graphs and charts-but you...


