EngageNY
Interpreting, Integrating, and Sharing Information: Using Charts and Graphs about DDT
Is American growing fatter? Scholars begin with a mini lesson on reading charts and graphs using information about Human Body Fat in United States. They then transfer what they learned to charts and graphs using harmful and beneficial...
Curated OER
Narnia Bar Charts
Here is a fabulous presentation that combines math and literature. Learners construct bar charts and frequency charts about things that happen in Narnia. Student pairs are assigned tasks regarding the variety of characters found in the...
University of North Carolina
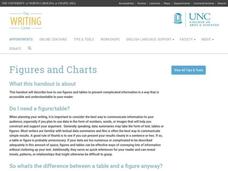
Figures and Charts
Sometimes words aren't the best way to get information across to the reader. The eighth handout in the 24-part Writing the Paper series describes different type of figures and charts to display complex information in a paper....
Curated OER
Math--Pictures and Bars--Learning About Graphs
What is a graph? What does it tell us? How do you make one? These are all questions that are answered in the included packet. It's a great introduction to graphing for young learners!
Curated OER
Graphing
Students collect data to create different types of graphs-line, pie, and bar graphs. They use StarOffice 6.0 to create graphs.
Curated OER
Explore Chapters 1 - 5
Students preview the novel, "Dragonwings," by Laurence Yep, make connections between the novel previewed and their prior knowledge, other texts, and the world. They utilize graphic representations including charts, graphs, pictures, and...
Curated OER
All About Graphs
Students practice organizing data by creating graphs. In this statistics instructional activity, students survey the class about favorite colors and create a bar graph using the data. Students complete a test based on pet and animal...
Curated OER
Tables, Charts and Graphs
Learners examine a science journal to develop an understanding of graphs in science. In this data analysis lesson, students read an article from the Natural Inquirer and discuss the meaning of the included graph. Learners create a...
Alabama Learning Exchange
Tiger Math Graphing
Learners practice various skills using the book Tiger Math: Learning to Graph from a Baby Tiger. After listening to the story, they create a pictograph using data collected from the text. They also color a picture of a tiger, collect...
Curated OER
Science: Teddy Bear Nation
Students sort teddy bears according to types and then graph the results. They each bring a bear to class and then discuss their similarities and differences. Once the bears have been sorted into groups according to size and color,...
Curated OER
Logs, Charts, and Journals: What's On Your Plate?
Have your writers identify and use words that appeal to the senses. They create a chart of sensory words and record some of their favorites, then write a journal entry in which they describe eating at a restaurant using sensory details....
Curated OER
The Mind-Body Connection
Second graders learn about the human body. In this biology lesson plan, 2nd graders will begin with the basics of understanding charts and graphs and progress into units that cover the body systems, and mental and emotional health....
McGraw Hill
Critical Thinking
Young economists engage in a series of activities designed to develop their critical thinking skills including identifying the main idea of a passage, cause and effect relationships, and making generalization based on the data included...
Shmoop
ELA.CCSS.ELA-Literacy.RI.11-12.7
Comparing information found in images, charts, and graphs with that found in written text can be a challenge for even senior high scholars. Provide learners with an opportunity to practice this skill with an exercise that asks them to...
Curated OER
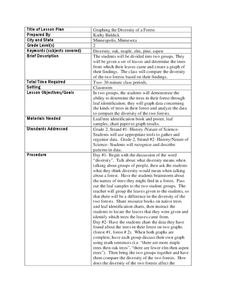
Graphing the Diversity of a Forest
Second graders work in groups to identify what types of trees create which types of leaves In this plant life lesson plan, 2nd graders analyze a set of leaves and identify the tree it came from while graphing the data in a science...
Curated OER
Just Graph It!
Students practice collecting data and organizing it into graphs. As a class, they collect birthday information from each of their classmates. To continue practicing, they examine the characteristics of different bugs and zoo animals. ...
K12 Reader
Displaying Data
It's important to learn how to display data to make the information easier for people to understand. A reading activity prompts kids to use context clues to answer five comprehension questions after reading several paragraphs about...
Curated OER
I'm a Changed Pig
Introduce your class to fairy tales with this lesson. After reading the fractured fairy tale, "The Three Little Wolves and the Big Bad Pig," third, fourth, and fifth graders write a personal narrative as a response to the fairy tale....
Curated OER
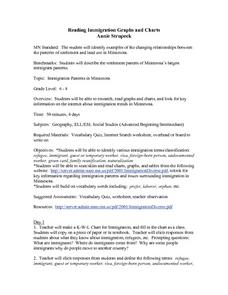
Reading Immigration Graphs and Charts
Students examine the settlement patterns and land use in Minnesota. In groups, they practice reading immigration graphs and charts and discuss why immigrants settled where they did. They are also introduced to new vocabulary related to...
Curated OER
Which Graph is best?
Pupils use commercial software to organize and visually display data to draw conclusions; students use graphing software to create several types of graphs illustrating the number of each color of M&M's in one bag.
Curated OER
Apple Adjectives
Study different apple varieties and use appropriate adjectives to describe them. Learners alphabetize both the apple names and the adjectives before creating spreadsheet, bar, and pie graphs. A mix of language arts, technology, and math!
Curated OER
The Gathering and Analysis of Data
Young mathematicians gather data on a topic, graph it in various forms, interpret the information, and write a summary of the data. They present their data and graphs to the class.
Curated OER
What Came From Where?
Pupils research patterns and networks of economic interdependence. They work cooperatively to create 3-dimensional representations of common objects and charts describing the objects' components and countries of origin. Students identify...
Curated OER
Twelve Days of Christmas--Prediction, Estimation, Addition, Table and Chart
Scholars explore graphing. They will listen to and sing "The Twelve Days of Christmas" and estimate how many gifts were mentioned in the song. Then complete a data chart representing each gift given in the song. They also construct...
Other popular searches
- Pie Charts and Graphs
- Reading Charts and Graphs
- Behavior Charts and Graphs
- Charts and Graphs Candy
- Interpret Charts and Graphs
- Charts and Graphs Christmas
- Charts and Graphs Math
- Analyzing Charts and Graphs
- Tables, Charts and Graphs
- Charts and Graphs Europe
- Using Charts and Graphs
- Bar Graphs and Charts


