Hi, what do you want to do?
Other
The Topic: Charts and Graphs
Brief descriptions of charts and graphs, followed by links to larger sites on the same subject.
Other
Hubspot: Data Visualization 101: How to Design Charts and Graphs
Your data is only as good as your ability to understand and communicate it, which is why choosing the right visualization is essential. Learn more in this guide.
Wolfram Research
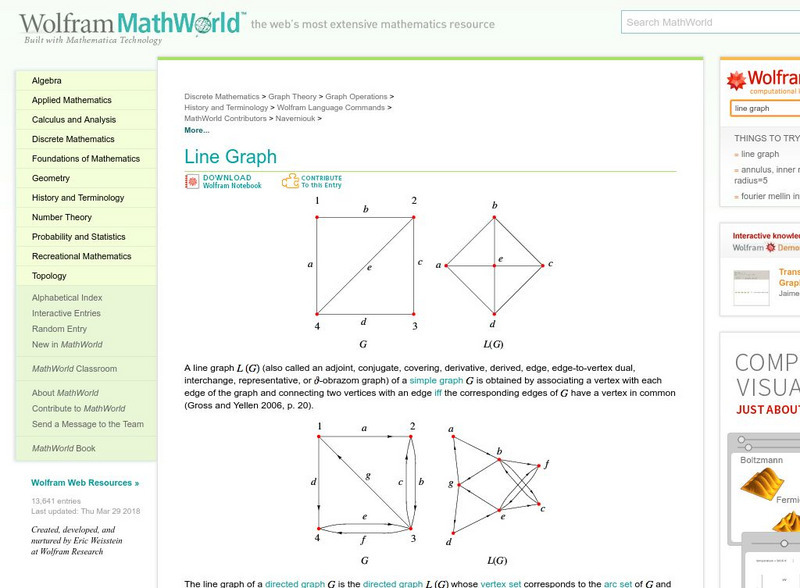
Wolfram Math World: Line Graph
Definition of a line graph with a variety of examples. Includes maps, charts, and detailed explanations for understanding.
Other
Kim's Korner: Graphic Organizers for Writing and Reading
What are graphic organizers for reading and writing? Use this site to learn more about these learning tools.
Other
Abp: P Ie Charts
This site from Accelerators and Beam Physics Group produces pertinent information regarding pie charts. Shows an example of a pie chart and breaks it up for easy learning.
The College of Physicians
The History of Vaccines: History of the Immunization Schedule
Charts and graphs showing the history of recommended vaccinations in the United States from 1945 to the present.
California State University
Reading Strategies From the University of Waterloo
Brief and easy to read, this California State University Northridge site lists strategies for getting the most of your reading. Geared for reading texts and technical material.
University of Illinois
University of Illinois: Early American Trade With China: Total Value of u.s Imports and Exports [Pdf]
Chart of total value of imports and exports of selected years from 1790 to 1900 in dollars. There are also questions that go along with the charts/graphs.
Other
Us Government: Fed Stats
This site shows charts, graphs, and information from more than 70 agencies in the United States Federal Government that produce statistics of interest to the public.
Other
Bucks County Community College: Visual Organizers
This site walks you through the benefits of visual organizers, and focuses on a variety of types: tables, charts, graphs, timelines, flowcharts, diagrams, and webs.
Curated OER
Long Run Costs and Production
A comprehensive, yet sophisticated explanation of long run costs of production. Includes charts and graphs to illustrate key points and concepts. Does tend to get somewhat advanced.
Curated OER
Long Run Costs and Production
A comprehensive, yet sophisticated explanation of long run costs of production. Includes charts and graphs to illustrate key points and concepts. Does tend to get somewhat advanced.
Curated OER
Long Run Costs and Production
A comprehensive, yet sophisticated explanation of long run costs of production. Includes charts and graphs to illustrate key points and concepts. Does tend to get somewhat advanced.
Curated OER
Long Run Costs and Production
A comprehensive, yet sophisticated explanation of long run costs of production. Includes charts and graphs to illustrate key points and concepts. Does tend to get somewhat advanced.
Other
Grinnell College: Histograms Area of Rectangles
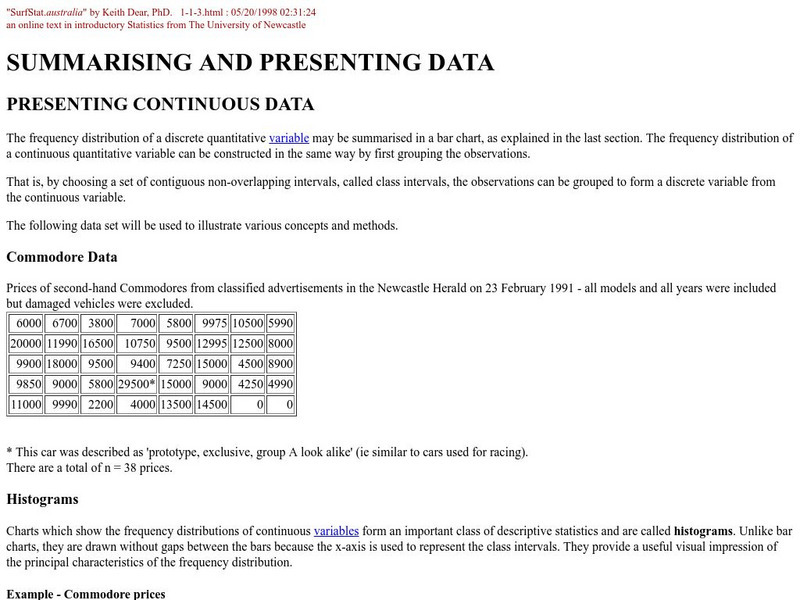
A sample problem is provided to help you create a histogram using a frequency distribution chart. Sample charts and formulas are provided to help explain how to find the area of the rectangles in the histogram and how to interpret what...
Centers for Disease Control and Prevention
Centers for Disease Control: Survey and Data Collection
Site contains statistical data for the National Center for Health Statistics.
Curated OER
A Ricardian Numerical Example
This site offers an in-depth analysis of "absolute advantage" and "comparative advantage", and includes supporting charts and graphs to support the examples that are given.
Curated OER
A Ricardian Numerical Example
This site offers an in-depth analysis of "absolute advantage" and "comparative advantage", and includes supporting charts and graphs to support the examples that are given.
Curated OER
A Ricardian Numerical Example
This site offers an in-depth analysis of "absolute advantage" and "comparative advantage", and includes supporting charts and graphs to support the examples that are given.
Curated OER
A Ricardian Numerical Example
This site offers an in-depth analysis of "absolute advantage" and "comparative advantage", and includes supporting charts and graphs to support the examples that are given.
English Zone
English Zone: Chart Reading Practice 1
Practice reading and understanding information when it is provided in chart format. This website provides a simple chart and asks questions about the chart's information, which can be answered and checked.
Virginia History Series
Virgina History Series: Virginia State History Post Wwii to Present Day [Pdf]
Visualize the major events in the last half of the 20th century such as major wars and civil rights issues through the lens of the state of Virginia. In addition, learn about the pop culture of this time specifically in Virginia. Enjoy...
Cornell University
Cornell University: Elasticity [Ppt]
This slideshow delves into the concept of elasticity. It discusses why elasticity is important, looks at the different kinds of elasticity, and has many supporting graphs and charts to use as examples.
Other
Vietnam War Commemoration: Statistics of the Vietnam War [Pdf]
Charts, graphs and text depicting significant statistics of the Vietnam War.
Other popular searches
- Pie Charts and Graphs
- Reading Charts and Graphs
- Behavior Charts and Graphs
- Charts and Graphs Candy
- Interpret Charts and Graphs
- Charts and Graphs Christmas
- Charts and Graphs Math
- Analyzing Charts and Graphs
- Tables, Charts and Graphs
- Charts and Graphs Europe
- Using Charts and Graphs
- Bar Graphs and Charts


