Hi, what do you want to do?
Texas Education Agency
Texas Gateway: Informational Text: Synthesize Information in Charts and Graphs
In this lesson, you will learn how to understand the data found in charts and graphs, and at the end of the lesson, you will practice what you have learned.
Texas Education Agency
Texas Gateway: Synthesize Information in Charts and Graphs (English Ii Reading)
Synthesize information that you find in charts and graphs.
Texas Education Agency
Texas Gateway: Synthesize Information in Charts and Graphs (English Ii Reading)
Synthesize information that you find in charts and graphs.
Quia
Quia: Reading Charts and Graphs Quiz
This 25-question quiz asks students to read various kinds of charts and graphs and to select the correct answers to the questions. Immediate feedback is provided after each question. Java is required.
Education Development Center
Tune in to Learning: Reading Charts and Graphs
Practice graph reading skills with these exercises and companion tutorials.
Other
Hubspot: Data Visualization 101: How to Design Charts and Graphs
Your data is only as good as your ability to understand and communicate it, which is why choosing the right visualization is essential. Learn more in this guide.
Texas Education Agency
Texas Gateway: Evaluating Data in Tables, Graphs and Charts
[Accessible by TX Educators. Free Registration/Login Required] In this lesson students look at examples of graphics, tables, charts, and graphs, and learn how to interpret their data. They will be able to use this skill to enhance their...
E-learning for Kids
E Learning for Kids: Math: Group of Pyramids: Fractions and Graphs
On this interactive website, students practice various math skills using a real-life scenario at the pyramids. Those skills include showing percentages as fractions and decimals and interpreting data in a sector graph.
Read Works
Read Works: The Olympics Then and Now
[Free Registration/Login Required] Students read two charts with information about the Olympics in ancient Greece and in modern times. A question sheet is available to help students build skills in comparing and contrasting.
National Center for Ecological Analysis and Synthesis, University of California Santa Barbara
Ucsb / Pie Graphs (Piece of Cake)
This page gives an example and easy-to-understand description of a pie graph (circle graph.) Also provides an opportunity for students to test their abilities to read a pie graph.
Beacon Learning Center
Beacon Learning Center: Interpreting Line Graphs
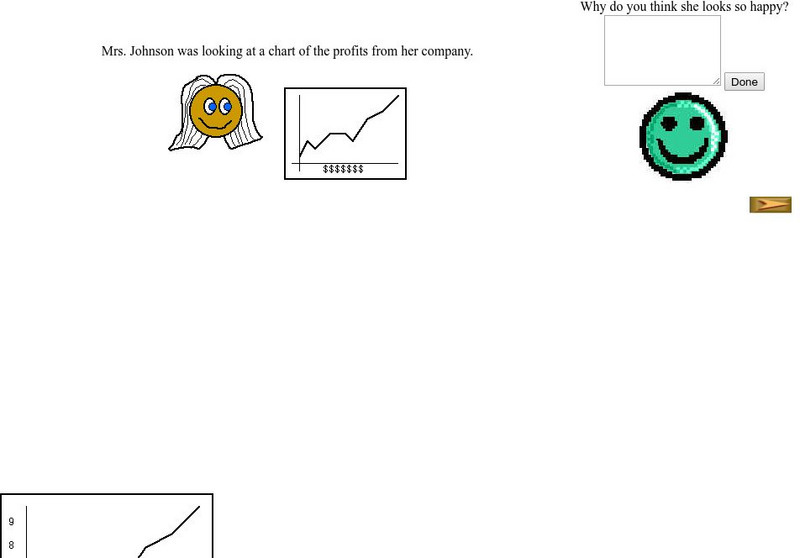
This site is a lesson on creating and interpreting a line graph. It explains how a line graph is created and then asks questions about what is learned from the data. Students type in open responses, and answers and feedback follow.
Colorado State University
Colorado State Writing Center: Charts
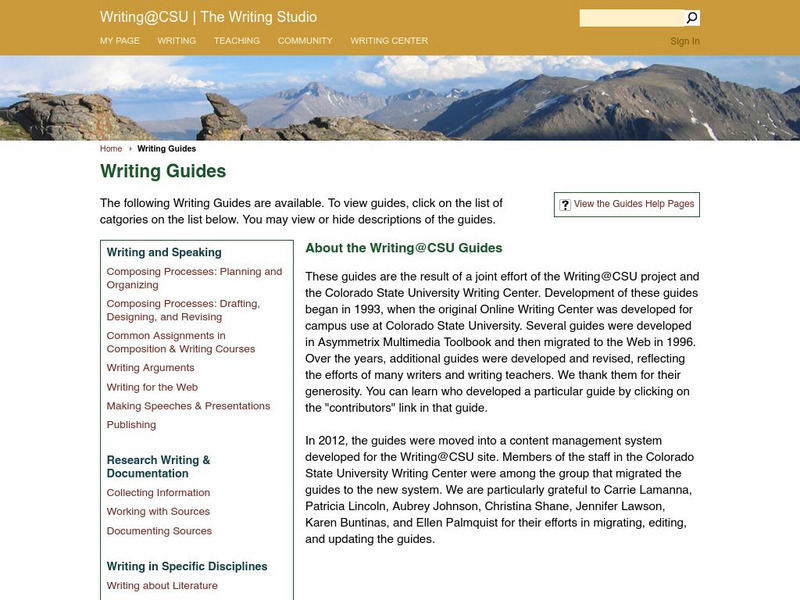
The use of charts and graphs can improve your presentations, whether on paper or as visual aids. Here you can read about how to create line, column, bar, pie graphs, and scatterplots. Just follow the links to their respective pages.
University of Cambridge
University of Cambridge: Maths and Sports: Match the Matches
Decide which charts and graphs represent the number of goals two football teams scored in fifteen matches. This data handling activity is designed to get children talking meaningfully about mathematics, presenting and justifying...
Texas Education Agency
Texas Gateway: Evaluate a Text for Its Graphics and Visual Appeal
Evaluate a text for the clarity and appeal of its graphics.
Texas Education Agency
Texas Gateway: Evaluate Graphics in Informational/procedural Text
You will learn how to evaluate graphics for their clarity in communicating meaning and achieving a specific purpose.
BBC
Bbc Skillswise: Graphs: Lists and Tables
Resource shows how to use lists and tables to organize information.
National Center for Ecological Analysis and Synthesis, University of California Santa Barbara
Nceas: Graph Types
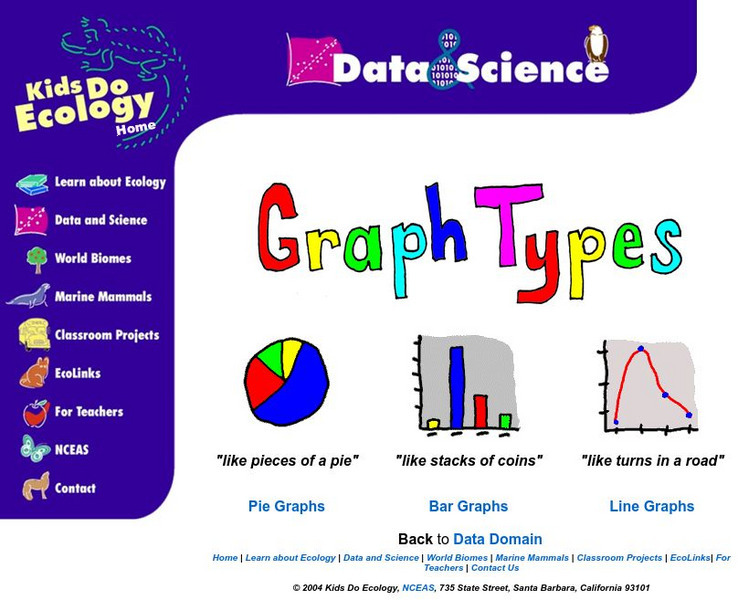
At this site from NCEAS you can learn how to organize your data into pie graphs, bar graphs, and line graphs. Explanations and examples are given of each graph along with several questions that check comprehension.
McGraw Hill
Glencoe: Self Check Quizzes 2 Circle Graphs
Use Glencoe's Math Course 2 randomly generated self-checking quiz to test your knowledge of circle graphs. Each question has a "Hint" link to help. Choose the correct answer for each problem. At the bottom of the page click the "Check...
City University of New York
Virtual Geology: Where on Earth: A Latitude and Longitude Quiz
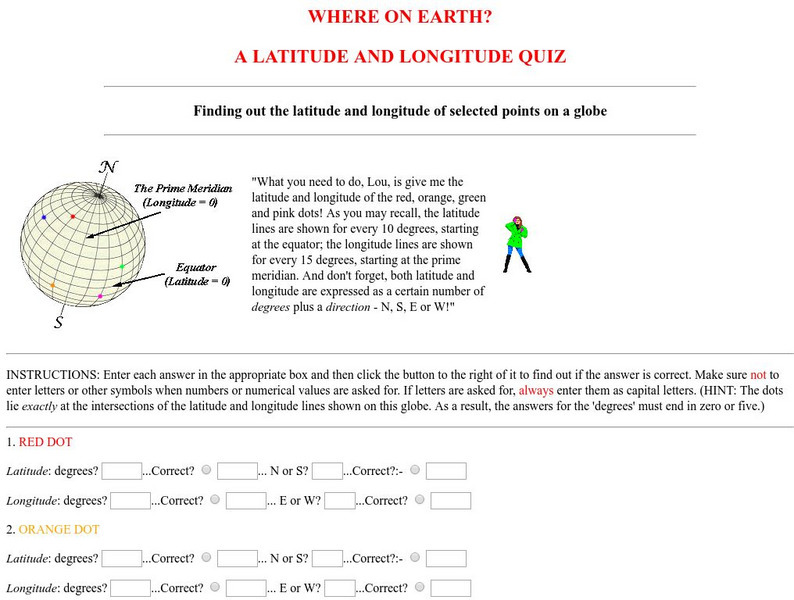
This quiz starts with select points on a globe. Students must determine the latitude, longitude, and direction for each point.
ClassFlow
Class Flow: Graphing Lists Tables
[Free Registration/Login Required] This lesson plan flipchart provides opportunities for interpreting information in simple tables and graphs.
University of Cambridge
University of Cambridge: Maths and Sports: Charting Success
Sports statisticians, trainers and competitors create graphs, charts and diagrams to help them to analyse performance, inform training programmes or improve motivation. This activity encourages students to consider and analyse...
US Department of Education
Nces Kids: Creating an Area Graph
This is where you will find step by step directions explaining how to create an area graph. Complete each step and click on the next tab. Directions are simple and clear.
Other
Nearpod: Graphing Equations Using a Table
For this lesson on graphing equations using a table, students will learn how to create a table for a function in terms of domain and range and then graph the function on the coordinate plane.
Texas Education Agency
Texas Gateway: Analyze Graphical Sources: Practice 2 (English I Reading)
This lesson focuses on practice exercises to understand and interpret the data in a graphic representations including pie charts, bar graphs, and line graphs.
Other popular searches
- Pie Charts and Graphs
- Reading Charts and Graphs
- Behavior Charts and Graphs
- Charts and Graphs Candy
- Interpret Charts and Graphs
- Charts and Graphs Christmas
- Charts and Graphs Math
- Analyzing Charts and Graphs
- Tables, Charts and Graphs
- Charts and Graphs Europe
- Using Charts and Graphs
- Bar Graphs and Charts


