Hi, what do you want to do?
Texas Education Agency
Texas Gateway: Evaluating Data in Tables, Graphs and Charts
[Accessible by TX Educators. Free Registration/Login Required] In this lesson students look at examples of graphics, tables, charts, and graphs, and learn how to interpret their data. They will be able to use this skill to enhance their...
Texas Education Agency
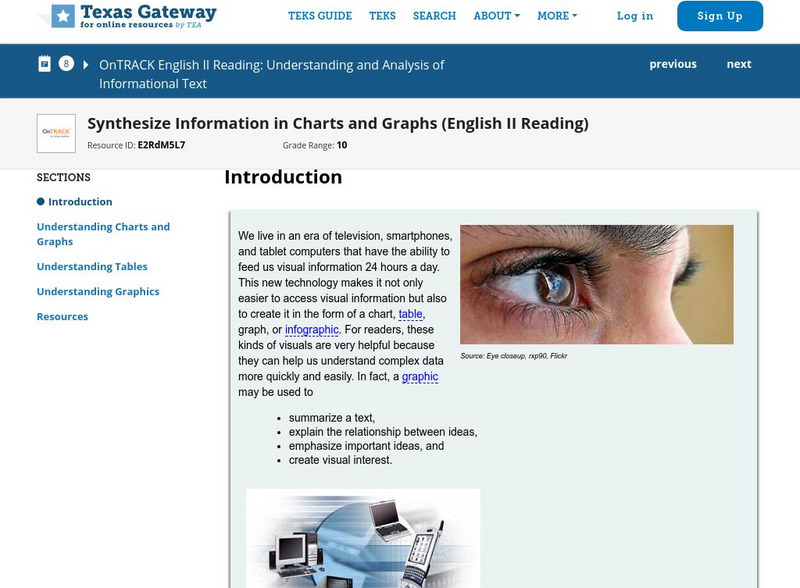
Texas Gateway: Informational Text: Synthesize Information in Charts and Graphs
In this lesson, you will learn how to understand the data found in charts and graphs, and at the end of the lesson, you will practice what you have learned.
Texas Education Agency
Texas Gateway: Synthesize Information in Charts and Graphs (English Ii Reading)
Synthesize information that you find in charts and graphs.
CK-12 Foundation
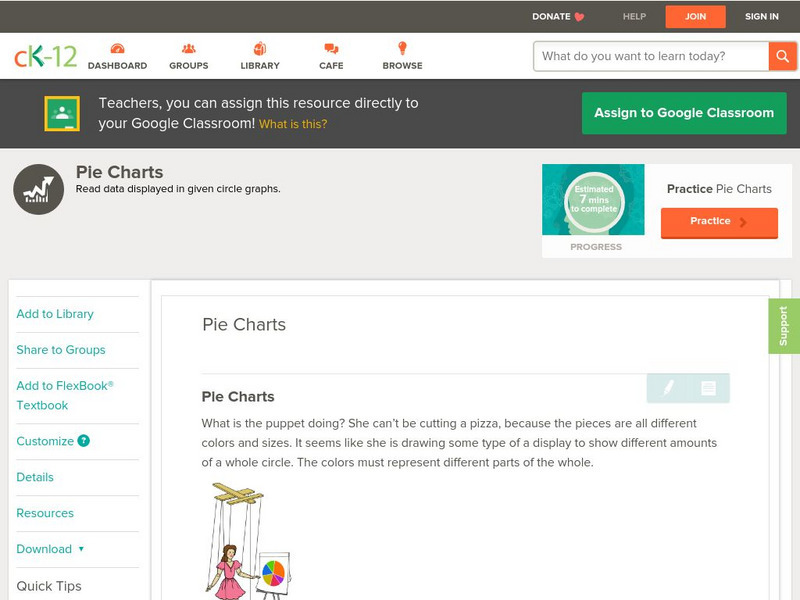
Ck 12: Statistics: Pie Charts Grades 9 10
[Free Registration/Login may be required to access all resource tools.] Covers representing data in a pie chart.
National Center for Ecological Analysis and Synthesis, University of California Santa Barbara
Ucsb / Pie Graphs (Piece of Cake)
This page gives an example and easy-to-understand description of a pie graph (circle graph.) Also provides an opportunity for students to test their abilities to read a pie graph.
Quia
Quia: Reading Charts and Graphs Quiz
This 25-question quiz asks students to read various kinds of charts and graphs and to select the correct answers to the questions. Immediate feedback is provided after each question. Java is required.
Sophia Learning
Sophia: Note Taking: Concept Maps and Flow Charts
This slideshow lesson focuses on note taking using concept maps and flow charts; it provides background information, 6 types of concept maps or flow charts with best uses, uses in the classroom, uses while reading or researching, and how...
Texas Education Agency
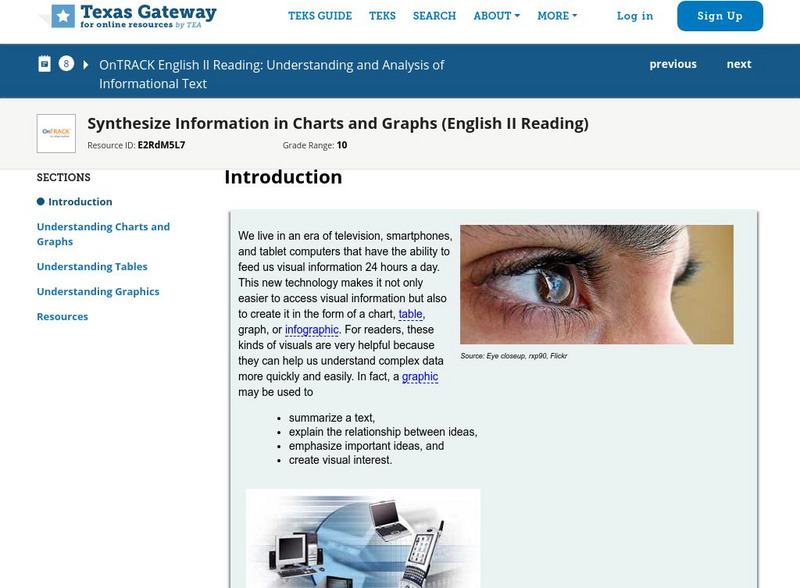
Texas Gateway: Synthesize Information in Charts and Graphs (English Ii Reading)
Synthesize information that you find in charts and graphs.
Math Is Fun
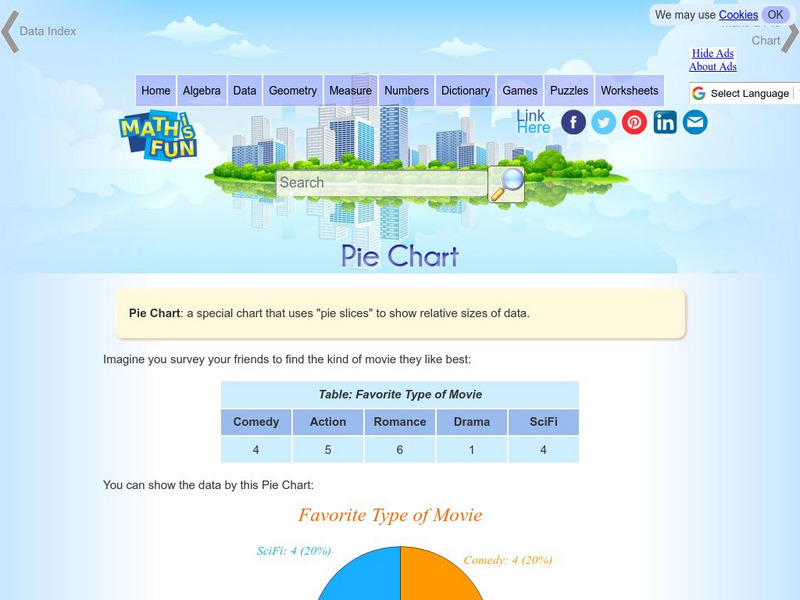
Math Is Fun: Pie Chart
Explains, with examples, what a pie chart is and how to make one. Includes a set of practice questions.
University of Cambridge
University of Cambridge: Maths and Sports: Charting More Success
This activity follows on from Charting Success and encourages students to consider and analyse representations of data from the world of sport, to make sense of the stories they tell, and to analyse whether the right representation has...
Colorado State University
Colorado State Writing Center: Charts
The use of charts and graphs can improve your presentations, whether on paper or as visual aids. Here you can read about how to create line, column, bar, pie graphs, and scatterplots. Just follow the links to their respective pages.
CK-12 Foundation
Ck 12: Statistics: Pie Charts Grade 6
[Free Registration/Login may be required to access all resource tools.] Interpret circle graphs and make predictions based on the displayed data.
PBS
Pbs: Off the Charts Web Karaoke
This online karaoke machine, developed for "Off the Charts," an episode about songwriters that aired on the award-winning PBS series "Independent Lens," lets you try out your songwriting talents. First you write the lyrics for a song set...
Other
Abp: P Ie Charts
This site from Accelerators and Beam Physics Group produces pertinent information regarding pie charts. Shows an example of a pie chart and breaks it up for easy learning.
Primary Resources
Primary Resources: Line Graphs and Pie Charts
Here are a few resources to use with your students when teaching about line graphs or pie charts.
Texas Education Agency
Texas Gateway: Analyze Graphical Sources: Practice 2 (English I Reading)
This lesson focuses on practice exercises to understand and interpret the data in a graphic representations including pie charts, bar graphs, and line graphs.
Science Education Resource Center at Carleton College
Serc: Rainfall and Elevation: A Charting and Critical Thinking Exercise
In this lab, students will learn to organize and present data in a visual way so that they can then summarize in writing their conclusions about the relationships between the data.
TeachEngineering
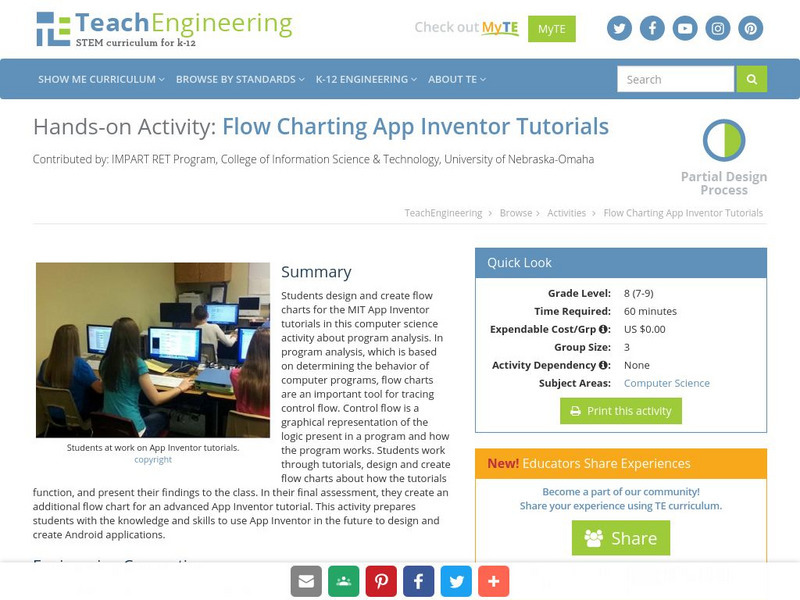
Teach Engineering: Flow Charting App Inventor Tutorials
Students design and create flow charts for the MIT App Inventor tutorials in this computer science activity about program analysis. In program analysis, which is based on determining the behavior of computer programs, flow charts are an...
Sophia Learning
Sophia: Representing Data With Pie Charts: Lesson 2
This lesson demonstrates how to represent data using a pie chart. It is 2 of 5 in the series titled "Representing Data with Pie Charts."
Sophia Learning
Sophia: Representing Data With Pie Charts: Lesson 4
This lesson demonstrates how to represent data using a pie chart. It is 4 of 5 in the series titled "Representing Data with Pie Charts."
Sophia Learning
Sophia: What Are Pie Charts?
This lesson defines the phrase pie chart. Students can look at a presentation and then take an online quiz.
American Institute of Biological Sciences
Action Bioscience: Nses Correlation Charts
A comprehensive collection of NSES correlated articles accompanied by many resources for researchers and educators.
University of Cambridge
University of Cambridge: Maths and Sports: Charting Success
Sports statisticians, trainers and competitors create graphs, charts and diagrams to help them to analyse performance, inform training programmes or improve motivation. This activity encourages students to consider and analyse...
Other popular searches
- Charts and Graphs
- Multiplication Charts
- Maps and Charts
- Tally Charts
- Pie Charts and Graphs
- Pie Chart
- Multiplication Charts to 100
- Reading Charts and Graphs
- Behavior Charts and Graphs
- Charts and Graphs Candy
- Interpret Charts and Graphs
- Charts and Graphs Christmas


