Curated OER
What is the Best Chip?
Scholars collect data about chips. They pick their favorite type of chip from a given variety such as potato chips, tortilla, or banana chips. Then they write on an index card their favorite chip and why it's their favorite. They also...
Curated OER
Simple Tally Charts and Bar Graphs
Introduce your first graders to the world of tally marks, bar graphs, and the organization of data. Pupils determine a favorite ice cream flavor based on tally marks, then use a bar graph to answer some questions about sports. There are...
Curated OER
Reading Charts
How well can your third graders interpret data from a chart? Use this straightforward worksheet to reinforce problem-solving skills. After reading a school schedule, pupils answer ten questions about the information in the chart. A great...
Curated OER
Analyzing Messages in Various Media
Explore communication through media by analyzing different advertisements and artwork. Budding artists view videos, websites, plays, and other artistic endeavors while discussing the true meaning of the work with their classmates. They...
Curated OER
Non-Fiction Text Features
Distinguish between textual features of non-fiction in the book The Lewis and Clark Expedition and in the non-fiction story "Ta-Na-e-Ka." Third graders create posters and participate in group discussions to show their understanding of...
Curated OER
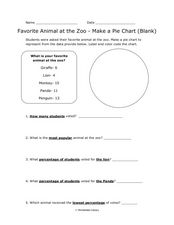
Pie Chart: Favorite Animal at the Zoo
In these three interpreting a pie chart and answering questions worksheets, students use the data provided to label and color code the blank and outlined pie charts, read and interpret a completed pie chart, and then answer questions...
Curated OER
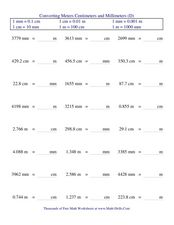
Multiplication Five Minute Frenzy Charts (B)
In this multiplication facts instructional activity, students complete four 10 by 10 grid charts with multiplication facts to 144. Students try to complete each chart in less than five minutes and score 98% or better.
Curated OER
Multiplication Five Minute Frenzy Charts (C)
For this multiplication facts worksheet, students complete four 10 by 10 grid charts with multiplication facts to 144. Students try to complete each chart in less than five minutes and score 98% or better.
Curated OER
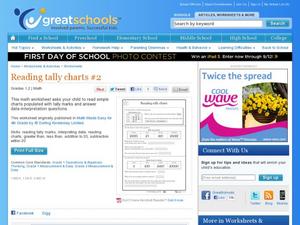
Reading Tally Charts #2
Keep count with tally marks! First graders practice reading tally marks with this straightforward learning exercise. They work with interpreting data from a chart, as well as working with addition and subtraction under 20. A great math...
Math Worksheets Land
Pie or Circle Graphs Problems - Independent Practice Worksheet
Third graders take a set of data and turn it into a pie graph with an independent worksheet. Containing 10 sets of data, the resource reinforced data analysis skills that pupils can use throughout a graphing unit.
Bowland
German or English?
Sprechen sie Deutsch? Future cryptographers must decide whether an unknown text is written in English or in German. They use provided pie charts about the frequency of words in the English and German languages to help make their decisions.
Yummy Math
US Holiday Candy Sales
Candy is a big business! Calculate the amount of money consumers spent on major holidays—Easter, Halloween, Christmas, Hanukkah, and Valentine's Day—based on the total amount of candy sales from 2011 and the percentage of each holiday's...
Curated OER
Data and charts
In this data and charts activity, students answer multiple choice questions referring to different charts about mountain heights, breakfast drinks, and more. Students complete 10 multiple choice questions.
Curated OER
Charts and Graphs
In this charts and graphs worksheet, students refer to charts and graphs to solve word problems. Students complete 10 multiple choice word problems.
Curated OER
Using Graphs and Charts
Students complete T charts and manipulate numbers using graphs and charts. In this math graphs and charts lesson, students review the concepts of pattern and function. Students then complete practice pages where they manipulate numbers...
Curated OER
Thanksgiving Feast (Read the Charts)
Students practice reading charts about foods country of origin. They interpret information and answer questions related to charts. They discover how food production adds to the economy.
Curated OER
Solving Multi-Step Problems
Use this multi-step problems activity to have your charges complete multi-step problems including money, fractions, charts, and more. They complete 30 problems total.
K12 Reader
Making Predictions
Read efficiently and effectively with a passage about making predictions and using headlines and visual aids as clues. After kids read a few paragraphs in the passage, they answer five comprehension questions on the side of the page.
Math Moves U
Collecting and Working with Data
Add to your collection of math resources with this extensive series of data analysis worksheets. Whether your teaching how to use frequency tables and tally charts to collect and organize data, or introducing young mathematicians to pie...
New York State Education Department
Global History and Geography Examination: January 2018
Finding a test that assess knowledge of global history and geography can be challenging, but here's a resource that solves the problem. Updated January 2018, the exam asks class members to analyze charts, primary sources, and graphic...
EngageNY
The Five W’s
Let's take the big W. Scholars analyze the model newspaper article Sandy wreaks havoc across Northeast; at
least 11 dead and look to answer who, what, when, where, and why. They work in groups of three to complete a Five W’s web...
Curated OER
Math for Fourth Grade: Statistical Charts
In this math for fourth grade statistical charts worksheet, 4th graders answer 7 multiple choice questions in standardized test format about data, charts and graphs.
Curated OER
Interpret Pie Charts
In this pie chart worksheet, students interpret pie charts, then answer a variety of questions about each. Answers are included on page 2.
Curated OER
Story Setting - The Art Lesson by Tomi dePaola
Students read the book The Art Lesson by Tomi dePaola and analyze the story. In this setting lesson, students discuss the importance of the setting and how it helps us understand the story. Students answer questions and chart their...


