Hi, what do you want to do?
Concord Consortium
Concord Consortium: Smartgraphs: Graphs Tell a Story
Students match a word story to the correct set of graphs involving temperature change over time.
CK-12 Foundation
Ck 12: Statistics: Line Graphs to Display Data Over Time
[Free Registration/Login may be required to access all resource tools.] Create line graphs to display how data changes over time.
Other
Bucks County Community College: Visual Organizers
This site walks you through the benefits of visual organizers, and focuses on a variety of types: tables, charts, graphs, timelines, flowcharts, diagrams, and webs.
PBS
Pbs: The Lowdown: What You Need to Know About Immigration Reform
Interpret graphs showing changes over time in the percentage of foreign-born US residents and in annual deportations in this interactive from KQED. In the accompanying classroom activity, students use the interactive and look at how...
Texas Instruments
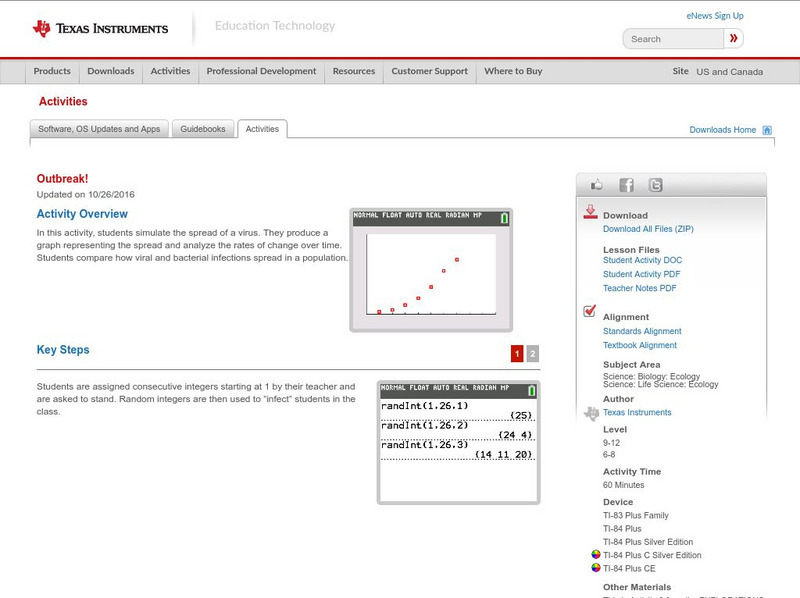
Texas Instruments: Outbreak!
In this activity, students simulate the spread of a virus. They produce a graph representing the spread and analyze the rates of change over time. Students compare how viral and bacterial infections spread in a population.
TeachEngineering
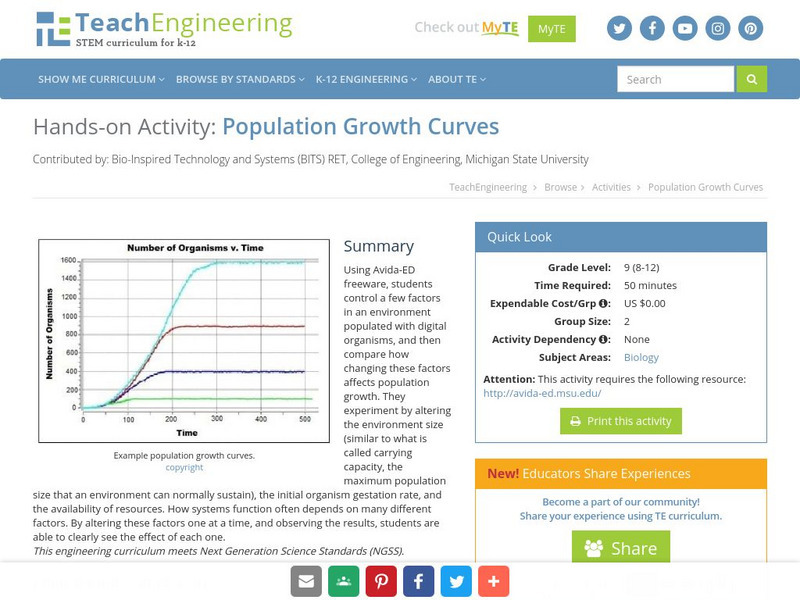
Teach Engineering: Population Growth Curves
Using Avida-ED freeware, students control a few factors in an environment populated with digital organisms, and then compare how changing these factors affects population growth. They experiment by altering the environment size (similar...
TeachEngineering
Teach Engineering: Natural Disasters
Students are introduced to our planet's structure and its dynamic system of natural forces through an examination of the natural hazards of earthquakes, volcanoes, landslides, tsunamis, floods and tornados, as well as avalanches, fires,...
US Department of Education
Nces: How to Create a Pie Chart
Resource from the National Center for Education Statistics provides tools and steps for creating printable pie charts online. Fill in the information, click the necessary buttons, and you have created a pie chart!
Sophia Learning
Sophia: Algebra I: Exponential Growth and Decay
A webpage containing notes explaining that exponential growth and decay show the change of a quantity over time. Notes give equation and graphs for exponential growth and decay.


