Curated OER
Applied Maxim Mininmum Problems
Students define the maximum and minimum of an equation. In this calculus lesson, students analyze point on a graph and determine when a graph is approaching a maximum or minimum. They take a Quiz after working some review problems.
Curated OER
Bottle Habitat
In groups of four, students construct aquatic habitats in pop bottles. They create charts and record data from observations over a four week period. Then they graph their data and write explanations for what they observed.
Curated OER
How Long? How Wide?
Second graders distinguish between and use nonstandard and standard units of measurement, use appropriate tools and techniques to measure length and width, and record and interpret data using graphs.
Curated OER
Area of Polygons #5
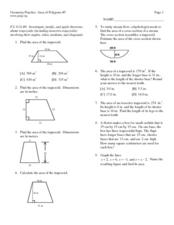
Students explore the concept of area. In this area worksheet, students find the area of trapezoids given a drawing and given equations of lines. Students answer 9 multiple choice problems.
Curated OER
The Wonders of Bacteria
Young scholars explore the evolution and features of bacteria through a series of activities. In this biology lesson plan, students collect data and graph bacterial growth. They design a brochure about bacteria's role in society.
Curated OER
Mr. Cobbler's Shoe Dilemma
Students employ statistics to solve real-world problems. They collect, organize and describe data. They make inferences based on data analysis. They construct, read, and interpret tables, charts and graphs.
Curated OER
Paper Parachutes
Students participate in a simulation of a parachute-jump competition by making paper parachutes and then dropping them towards a target on the floor. They measure the distance from the point where the paper parachute lands compared to...
Curated OER
How Wet Did It Get?
Students measure the rainfall/snowfall on the playground on a rainy/snowy day with a rain/snow gauge. They draw a bar graph representing the amount of water that fell and observe a satellite image of the clouds and local weather system...
Curated OER
What's My Ratio?
Students investigate ratios of various objects. In this ratios of various objects lesson plan, students draw pictures on graph paper and then dilate or shrink the image. Students determine the ratio of their pictures. Students trade...
Curated OER
Map Making/Floor Plans/Map Reading
Learners apply their knowledge of scale when mapping the classroom. They determine the use of a map legend and orient a map using a compass. They create the classroom maps using transfer graph paper.
Curated OER
More Bait for Your Buck!
Students determine where to buy the heaviest earthworms as they study invertebrates. They create a double bar graph of the results of the weight data.
Curated OER
Play Dough Day
Twelfth graders build a model of the following figures with the base from column I and the cross-section from column II. Draw the base with labeled axes on the graph paper and construct the figure on top of the base with the play dough...
Curated OER
"If You Hopped Like a Frog" by David M. Schwartz
Students search for and generalize an algebraic pattern. They make and analyze a coordinate graph.
Curated OER
Connecting Measurement
Students participate in activities the connect measurement to geometry, statistics, estimation, and the real world. They collect measurements from their elbow to the tip of their middle finger and make a box plot of the data as well as...
Curated OER
Let's Take a Chance!
Students investigate probability and the chance of an even happening. In this algebra lesson, students incorporate their knowledge of probability to solve problems and relate it to the real world. They learn to make decisions based on data.
Curated OER
Who's the Frog Jumping Champion?
Students use a simple machine (a lever) to launch a plastic frog. students determine who is able to make their frog "jump" the farthest and graph the results.
Curated OER
Sampling Rocks
Students examine how to take a sample by looking at rocks in the schoolyard. In this sampling instructional activity, students discuss ways to classify rocks by color, size, and weight. They think about how many rocks would make a good...
Curated OER
Who's got the fastest legs?
Students use a stopwatch to collect information for a scatterplot. In this fastest legs lessons, students collect data through the taking of measurements, create and find a median number. Students develop an equation and answer...
Curated OER
Fun Activities Using Seeds
Students analyze the size, shape, and form of several different seeds. In this all about seeds lesson plan, students complete four activities involving characteristics of seeds. Students observe the seeds, record information about the...
Curated OER
How Far Can a Frog Jump?
Fourth graders are introduced to how to take measurements in the metric system. After defining new vocabulary, they read a story by Mark Twain about jumping frogs. In groups, they simulate a frog jumping contest in which they made...
Curated OER
Student Heights
Students measure the heights of their fellow classmates and create a box and whisker plot to display the data. In this measurement lesson plan, students analyze the data and record results.
Curated OER
Observations and Inferences
Students examine coral skeletons. In this science lesson plan, view real coral skeletons. Students explain the differences between an observation and an inference. Students draw a coral skeleton.
Curated OER
Wet Weather, Wet Climate
Students discover the differences between weather and climate in this long-term lesson introduction. They create rain gauges and practice reading rainfall measurements, view a website showing the cloud cover in their location and draw...
Curated OER
Math/Technology: Height Measurement
Third graders, using technology tools, determine the total height of their classmates in both inches and centimeters. Once the measurements are taken, they enter the results in the Excel file. Once students have prepared a KidPix number...


