Curated OER
Fractile vs. Equal
Students compare and contrast methods of categorizing data. In this data collection instructional activity, students complete worksheet activities that require them to note the differences between equal and fractile intervals. Students...
Curated OER
Deciphering Your Cell Phone Bill
You just got your first cell phone bill, but what does it all mean? Clear up the confusion for your young consumers as they break down and itemize a cell phone bill to better understand what they are paying for and why. This type of...
Curated OER
Climographs
Students identify trends and characteristics of climate zones and specific places within. Then, they graph annual climate trends (primarily Temperature and Precipitation) and create, interpret and extrapolate information based on...
Museum of Tolerance
Where Do Our Families Come From?
After a grand conversation about immigration to the United States, scholars interview a family member to learn about their journey to America. They then take their new-found knowledge and apply their findings to tracking their family...
Curated OER
National Longitudinal Survey of Children and Youth (NLSCY)
Students review data analysis techniques. In this statistics lesson, students access statistical software regarding the National Longitudinal Survey of Children and Youth. Students read and interpret the data as they complete the...
Curated OER
Human Evolution: Biology, Bones
Learners will love a weeks worth of bone study. They use bones and characteristics of bones to explore the evolution of hominoids. Bones are compared, categorized, and considered. A great way to bring physical anthropology and material...
Curated OER
Kinzi Deaf Alumni
Pupils use data of school alumni to create a database. The lesson uses technology and access to a computer lab is essential. The concepts of graphing statistics is also used to help teach across the curriculum.
Curated OER
What's For Dinner?
Eighth graders discover how the location of restaurants affects the future location of different restaurants. Using a fictionous town, they map the locations of all current restaurants and analyze the data to determine what type of...
Curated OER
The Importance of Imports
Students explore world trade by examining items they find at home and listing countries those items came from. Data is displayed on a map and charted according to continent. They discuss how products are transported.
Ocean Explorer
Looking for Clues
Upper graders become "shipwreck detectives" by studying the debris field from a shipwreck in the Aegean Sea which took place in the 700s. A website is accessed that gives specific information about the debris field, and pairs of...
Curated OER
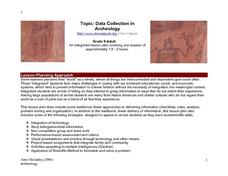
Data Collection in Archaeology
Young scholars research different types of rock art and categorize it into basic groups, classify Powerpoint Images according to interpretation, enter findings into Access template, and interpret results after comparing information with...
Curated OER
Identifying Economic Systems
Young historians practice identifying evidence to categorize a particular country's economic system as either a mixed, centrally planned, traditional, or free economic system in this two-part lesson.
Curated OER
Plotting Slave Population Density in Connecticut in the 1700's
Tenth graders explore slavery in the U.S. by researching the web. In this U.S. history instructional activity, 10th graders identify the geography of Connecticut and the overall involvement the state had in the slavery process. Students...
Curated OER
The Roar of the Twenties; The Crash of the Thirties
Eighth graders, after assuming identities of prominent figures from the 1920's and looking at slides and data from the era, relate, in diary form, the cultural, economic and political changes that happened in America between 1920 and 1939.
Curated OER
Caching in Pine's Treasures
Students compile image information about the Junior High School using a digital camera. They survey the area making observations and recording them with the help of portable technology and transferring the data to a spreadsheet and...
Curated OER
California Missions
Fourth graders use what they already have gathered on California missions to create a database. Using the different missions, they brainstorm, organize and categorize what they have gathered. They present their material to the class and...
Curated OER
Immigration Push and Pull Factors
Eighth graders explore the definitions for push and pull factors and determine whether reasons for immigration are considered push or pull factors. They then determine their own reasons for immigration and categorize them.
Curated OER
Checking County Numbers
Students use their county's information page to gather information about their community. Using the information, they create graphs from the tables provided and interpret the data. They write a paragraph showing their interpretation of...
Curated OER
Away We Go!
Students study types of transportation. In this transportation lesson, students survey several classes to gather data on how they get to school. Students create a transportation graph.
Curated OER
Analysing 2001 Census Microdata
Eighth graders examine the census data of 2001. In this American History lesson, 8th graders analyze data using one- and two-variable statistical analysis. Students develop a research question that makes use of the microdata.
Curated OER
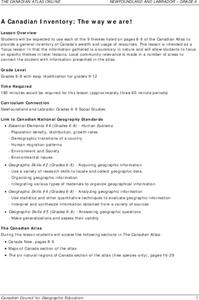
A Canadian Inventory: The Way We Are!
Students use the Canadian Atlas to discover an inventory of Canada's wealth and usage of resources. Using charts and graphs, they produce a wall of selected data of importance to the country and identify one issue of sustainability. ...
Curated OER
"Mr. Betts and Mr. Potts"
First graders listen to the book "Mr. Betts and Mr. Potts" and examine the career of being a veterinarian. They categorize animals based on whether they could be house pets or not, develop a class pet graph, and list the various...
Curated OER
House Bill No. 4097
Students identify healthy and unhealthy foods while considering a bill that would ban certain foods in schools. Through survey and discussion, they discuss a proposed legislative bill that would ban certain types of food in schools....
NOAA
A Watery World
With about 70% of the earth's surface covered in oceans, it's fair to say that we live in a very wet world. Young scientists gain a better appreciation of this fact as they use maps to identify the world's ocean basins in the first...
Other popular searches
- Categorical Data Worksheet
- Classify Categorical Data
- Numerical vs. Categorical Data
- Numerical vs Categorical Data


