Curated OER
Is there Treasure in Trash?
More people, more garbage! Young environmentalists graph population growth against the amount of garbage generated per year and find a linear model that best fits the data. This is an older resource that could benefit from more recent...
Curated OER
Kinzi Deaf Alumni
Students use data of school alumni to create a database. The lesson uses technology and access to a computer lab is essential. The concepts of graphing statistics is also used to help teach across the curriculum.
Curated OER
Moving Day!
Eighth graders continue their geometry unit by focusing on volume. Using data, they create a spreadsheet, estimate and calculate volume. They solve real-life problems and round their answers to the hundredths place. They also practice...
Curated OER
Away We Go!
Students study types of transportation. In this transportation lesson, students survey several classes to gather data on how they get to school. Students create a transportation graph.
Utah Education Network (UEN)
Linear Relationships: Tables, Equations, and Graphs
Pupils explore the concept of linear relationships. They discuss real-world examples of independent and dependent relationships. In addition, they use tables, graphs, and equations to represent linear relationships. They also use ordered...
Mathalicious
Pic Me!
Finally! Math and Instagram have come together to discuss the correlation between likes and followers. High schoolers can't help but want to discover what makes one account more popular than another by developing a line of best fit and...
Curated OER
Understanding Hurricanes and the ER-2
Students study hurricanes; in particular, what they look like, how they are formed, how they are categorized, how they are named, and how they are tracked. They examine the science of hurricanes as well as the mathematics of hurricanes.
Curated OER
Classification of Cerealites
Students create a dichotomous key. In this categorizing instructional activity, students create a dichotomous key for different types of cereal. Students classify the cereal into groups such as flakes and cereal with holes. Students...
Curated OER
The Great Pollinators
Students discover the reproductive parts of a plant. In this biology lesson, students identify and categorize several different plants they dissect in class. Students record their information using a data chart.
Curated OER
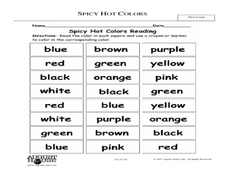
Spicy, Hot Colors
Students demonstrate an understanding of colors. In this visual arts lesson, students read the text Hot, Spicy Colors and name their favorite colors. Students complete a bar graph to show the data. Students discuss how each color can...
Curated OER
Graphing Trash Material
Students investigate recycling. In this reuse and recycle lesson, students examine the number and kinds of materials they discard. It also encourages them to think about taking action by reusing and recycling some of these items....
Curated OER
More Jelly Bean Math
Students use their color categorized jelly beans to find the range, mean, median and mode. They use their recorded data documenting how many jelly beans there are for each color in order to calculate the range, mean, median and mode of...
Curated OER
Education for Global Peace
Students survey the class and graph the results. In this graphing and data collection lesson plan, students conduct a survey to see where their shirts were produced. Individuals use software to graph the results and create a written...
Curated OER
Direct and Inverse Variation
Eighth graders participate in two data collection activities that involve direct and inverse variation. In the pre-assessment, 8th graders categorize numerical, graphical, and verbal representations as linear or nonlinear and determine...
Curated OER
Graph Lab
Seventh graders explore bar graphs and pie charts. Given a pack of M&Ms, 7th graders explore the colors, sort the data in a frequency chart and then construct bar graphs and pie charts to categorize the M&Ms by color. Students...
Curated OER
Paper Parachutes
Students participate in a simulation of a parachute-jump competition by making paper parachutes and then dropping them towards a target on the floor. They measure the distance from the point where the paper parachute lands compared to...
Curated OER
Mean, Median, Mode and Range
Seventh graders identify the mean, mode, median and range in a given set of data. After playing "What's My Number" game, 7th graders brainstorm situations in which measurement of statistical data is important. They measure specified...
Curated OER
Whirlybirds
Students measure to the nearest centimeter, and predict the frequency of an event. In this statistics instructional activity, students participate in a simulation of a parachute jump competition by making paper Whirlybirds, and then...
Curated OER
Plotting Slave Population Density in Connecticut in the 1700's
Tenth graders explore slavery in the U.S. by researching the web. For this U.S. history lesson, 10th graders identify the geography of Connecticut and the overall involvement the state had in the slavery process. Students view data of...
Curated OER
Checking County Numbers
Students use their county's information page to gather information about their community. Using the information, they create graphs from the tables provided and interpret the data. They write a paragraph showing their interpretation of...
Curated OER
The Mathematics of Space and Place
Young scholars investigate the measurements and geometry of the school grounds. They conduct inquiry while measuring the campus and some of the city blocks. Then students draw a map to scale and categorize property types using a pie graph.
Curated OER
Chances Are: Talking Probability
Students explore probability and the process of data analysis and predictions. They participate in two activities, one involving a calculator and one the Internet, in which they make predictions and conduct activities to test their...
Curated OER
What is It? Susie Sees!
Students explore the five senses. For this cross curriculum five senses lesson, students view an "I Can See Colors" PowerPoint presentation and sort items by color and shape. Students mix primary color paints to create secondary colors,...
Alabama Learning Exchange
The Grouchy Ladybug
Students listen to the book, "The Grouchy Ladybug" by Eric Carle and sequence the events in the story. Using a graph, they draw and color the animals that the ladybug meets next to the corresponding time from the story, and conduct...
Other popular searches
- Categorical Data
- Categorical Data Worksheet
- Classify Categorical Data
- Categorical Numerical Data
- Numerical vs. Categorical Data
- Numerical vs Categorical Data


