Curated OER
Human Population Growth
In this human population growth worksheet, learners create a graph of human population growth and predict future growth using the data given in a chart. Students identify factors that affect population growth.
Curated OER
Investigating Parabolas
In this investigating parabolas worksheet, 9th graders solve and graph 7 different problems that include graphing various equations that represent parabolas. First, they sketch their graphs to each problem. Then, students determine what...
Curated OER
Domain and Range
In this domain and range learning exercise, students examine graphs and find the domain and range of each function. This one-page learning exercise contains 6 problems.
Curated OER
Graphing Ordered Pairs
Seventh graders investigate the concept of ordered pairs as found in Algebra. They are introduced to the data set that corresponds to the coordinate system. Also students practice the graphing the ordered pairs using the x and y axis.
Curated OER
Graphing and the Coordinate Plane
Students learn about the Cartesian coordinate plane, understand the four quadrants of the Cartesian coordinate plane, and plot points on the plane. Students read coordinates for a point from a graph and give the ratio of rise over run...
Utah Education Network (UEN)
Integers on a Coordinate Plane
Boogie fever! Explore the concept of integers on coordinate plane. In this integers on a coordinate plane instructional activity, students graph rational numbers on the coordinate plane and identify coordinates of a point. Students...
Curated OER
Graphs
In this graphing worksheet, 6th graders name the place that is at the coordinates given to them of this graph of the city. Students complete 8 problems.
Curated OER
Coordinates (3)
In this math instructional activity, students explore coordinate graphing by analyzing a graph which has points plotted on both positive and negative sides. Students locate the points indicated and write the ordered pairs. There are no...
Curated OER
Algebra: Co-ordinates
Students use Cartesian coordinates. In this graphing lesson plan students use simple formulae, interpret coordinates, and create graphical representations. They express their work algebraically.
Curated OER
Introduction Points
In this math activity, middle schoolers find the points on the Cartesian plane. The graphs use the color green and red to differentiate the positive and negative points.
Curated OER
Graphing Inequalities in Two Variables: Extra Practice 30
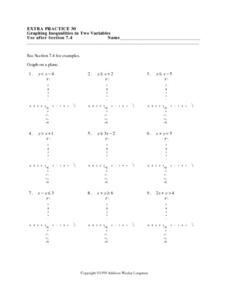
In this math worksheet, students graph inequalities on a coordinate grid. The eight problems have a coefficient of one for the y variable. Three problems have a negative value for y. The final four problems are horizontal or vertical lines.
Curated OER
Graphing Inequalities
In this graphing inequalities worksheet, learners complete 8 inequality tables. Students then graph and shade the 8 inequalities on a coordinate plane.
Curated OER
Equations: Graphs, Lines, Slope
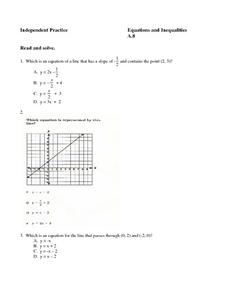
In this equations worksheet, students complete 8 multiple choice questions regarding writing equations in slope-intercept and matching an equation to its graph in the coordinate plane.
Curated OER
Impossible Graphs
Students distinguish between possible and impossible graphs of functions, and to learn why some graphs are impossible. They have practiced plotting functions on the Cartesian coordinate plane
Curated OER
Polar and Cartesian Coordinates
Students review polar coordinates, as well as translations and rotations in Cartesian Coordinates. They also watch a video on conics and write a summary of the video for a quiz grade. Students then find an equation after a...
Curated OER
Coordinate Grid Paper
In this coordinate grid worksheet, students plot point on the grid. Sheet is a blank template only with no specific associated activities. A website reference for additional resources is provided.
Curated OER
Ellipses and Kepler's First Law
The class examines graphs in the form r = F(¿¿) in polar coordinates (r, ¿¿), in particular with the circle, ellipse and other conic sections. They determine the nature of an ellipse by studying the role of the semimajor axis and...
Curated OER
7th Grade Math Worksheet
In this integers activity, 7th graders solve 10 different problems that include various types of integers and graphs. First, they determine the sum of 3 consecutive integers. Then, students find the ratio between 2 areas of similar...
Curated OER
Fishing for Points
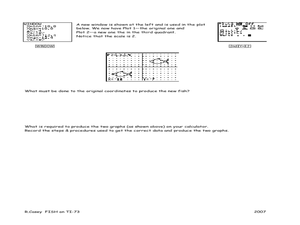
Learners explore the concept of ordered pairs. In this ordered pairs lesson, pupils list the ordered pairs of a graph in the shape of a fish. They use their calculator to translate the fish using lists, then translate the fish left,...
Curated OER
Intersecting Graphs
Ninth graders know how to solve a system of linear equations, but what happens when the system involves an exponential function? The instructional slideshow teaches viewers to determine solutions to systems of equations with linear and...
Curated OER
Discovering PI
In this pi worksheet, students identify and complete 4 different problems that include pi and graphing data points. First, they complete the chart at the top by measuring the diameter and circumference of each object. Then, students plot...
Curated OER
Addition of Ordinates
In this college algebra worksheet, students view graphs of two functions. They are given a values chart. Students graph the result of adding the two functions.
Curated OER
Rise Over Run
In this rise over run worksheet, learners solve and complete 2 different problems that include determining the rise over run for a race ran. First, they use the information in the table to graph each person's performance using a...
Curated OER
Cartesian Coordinate System
Students research the Cartesian Coordinate System and its many uses in the world of mathematics and algebra.


