Hi, what do you want to do?
Climate Literacy
Clean: Carbon Cycle
This activity from NOAA Earth System Research Laboratory introduces students to the current scientific understanding of the greenhouse effect and the carbon cycle. The activity leads them through several interactive tasks investigating...
TeachEngineering
Teach Engineering: Biorecycling: Using Nature to Make Resources From Waste
By studying key processes in the carbon cycle, such as photosynthesis, composting, and anaerobic digestion, students learn how nature and engineers biorecycle carbon.
Climate Literacy
Clean: Carbon Dioxide Sources and Sinks
For this lab activity, students use a chemical indicator (bromothymol blue) to detect the presence of carbon dioxide in animal and plant respiration and in the burning of fossil fuels and its absence in the products of plant...
Climate Literacy
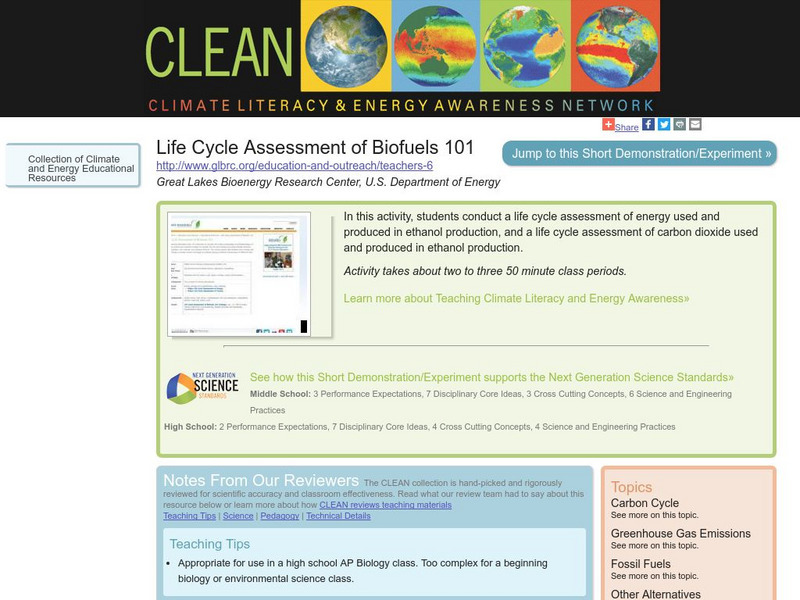
Clean: Life Cycle Assessment of Biofuels 101
Multi-lesson activity in which students conduct a life cycle assessment of energy and carbon dioxide used and produced in ethanol production.
Other
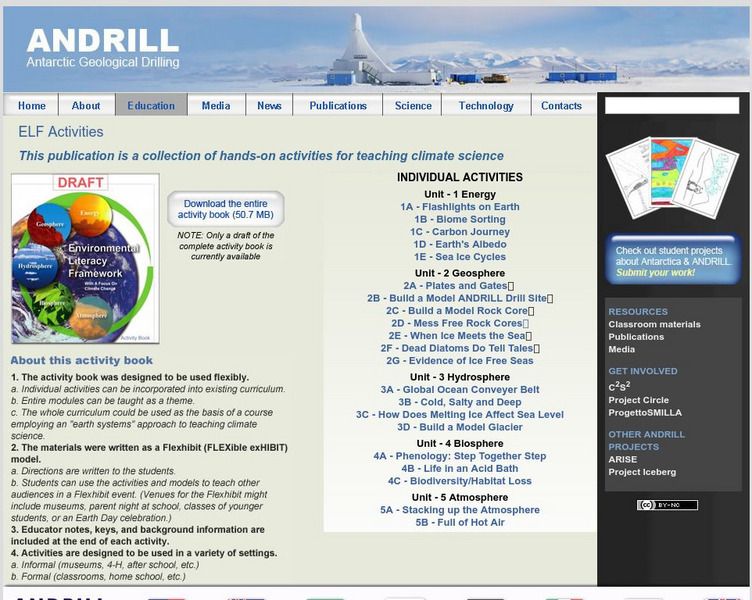
Antarctic Geological Drilling: Environmental Literacy Framework Activities
An impressive collection of lessons on climate science and climate change. The entire book can be downloaded. As well, each lesson has its own page with some combination of background information, PowerPoints, images, maps, glossaries,...
Science Education Resource Center at Carleton College
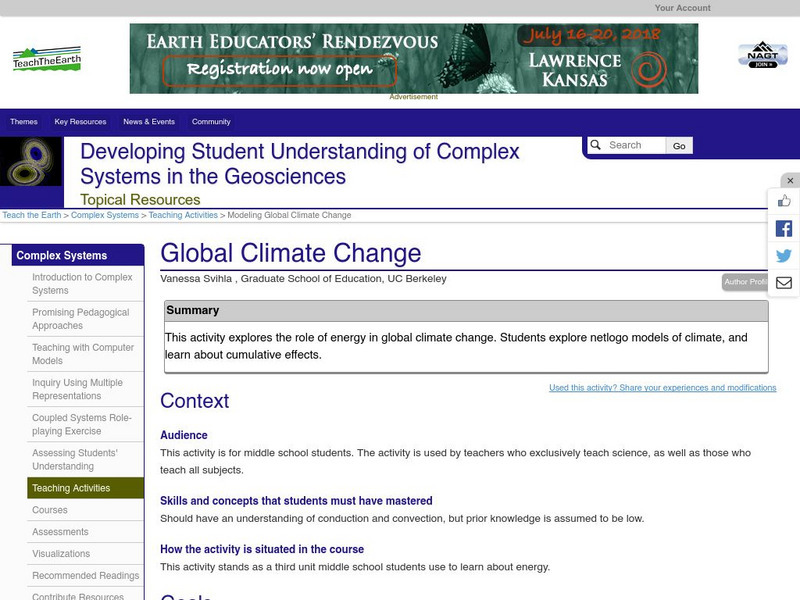
Serc: Modeling Global Climate Change
Students will gain an understanding of global climate change by exploring the role that energy plays in it. They will explore NetLogo models of climate and learn about cumulative effects.
Climate Literacy
Clean: Mt. Pinatubo and the Atmosphere
This lesson explores the impact of volcanic eruptions on the atmosphere. Students will analyze three types of visual information: a graph of aerosol optical depth v. global temperature, a global map with temperature anomalies, and an ash...


