Illustrative Mathematics
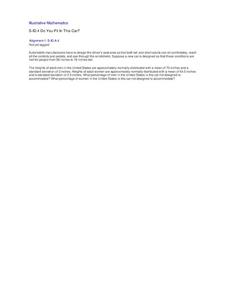
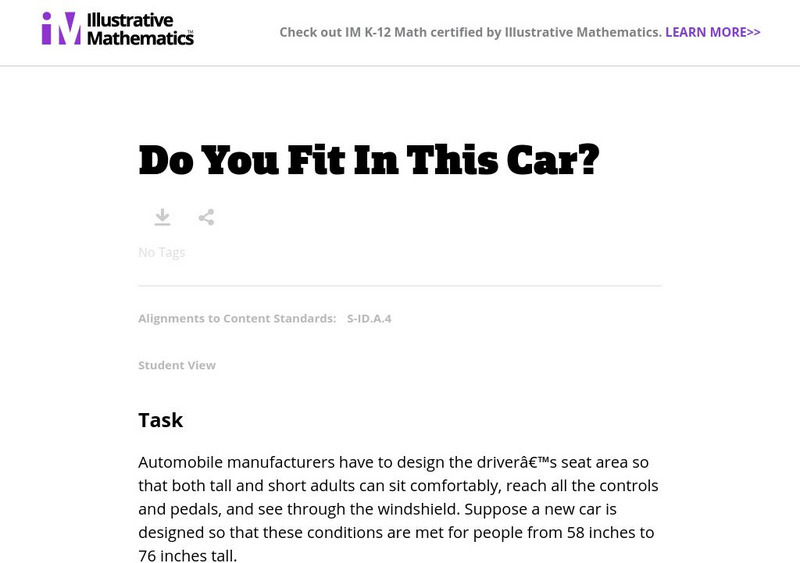
Do You Fit In This Car?
A short activity that focuses on the normal distribution as a model for data distribution. Using given means and standard deviations, your budding statisticians can use statistical tables, calculators, or other statistical software to...
Curated OER
Calculating Discounts and Sales
Students discover that a discount is used by manufacturers and merchants to mean taking off a certain percentage of the price given in a price list. This price is called the list price. The list price less the discount is known as the...
EngageNY
Scatter Plots
Scholars learn to create scatter plots and investigate any relationships that exists between the variables with a lesson that also show them that statistical relationships do not necessarily indicate a cause-and-effect...
Curated OER
Sustainable Transportation
Here is an impressive series of lessons that has learners work together to create a sustainable community transportation plan that could be implemented where they live. This is an ambitious project for your pupils to take on, and will...
Teacher Created Resources
How to Calculate Discounts and Sales
Teach discounts and sales with a straightforward instructional activity. After reviewing the concept, pupils solve word problems related to dollars and percentages. The second half of the sheet prompts learners to continue solving...
Curated OER
Statistical Process Control
In this statistical process control worksheet, students solve and complete 15 various types of problems. First, they estimate the standard deviation of the given process. Then, students use the target value as a center line and draw a...
Curated OER
Applied Science - Science and Math Lab
Students examine fabric. In this Applied Science lesson, students look at the fibers of fabric through a microscope. Students compare and contrast a variety of fibers.
Curated OER
Compound Inequalities
In this algebra learning exercise, 11th graders solve compound inequalities and graph their solution on a number line. There are 6 questions with an answer key.
Curated OER
What a Waste
Students analyze components of garbage. They collect and sort a few days' worth of garbage. They chart the results of an investigation.
Curated OER
Graphing Data Brings Understanding
Students collect, graph and analyze data. For this statistics lesson, students use circle, pie, bar and lines to represent data. They analyze the data and make predictions bases on the scatter plots created.
Illustrative Mathematics
Illustrative Mathematics: S Id.4 Do You Fit in This Car?
Students are tasked with solving a common issue for automobile manufacturers that require the students to use normal distribution as a model for data distribution. They will also use mean and standard deviation to figure out the problem....


