Curated OER
Data Analysis and Probability: Graphing Candy with Excel
Collect and graph data using Microsoft Excel with your math class. They will make predictions about the number of each colored candy in a bag of M&M's, then sort, classify, count, and record the actual data before using Excel to...
Curated OER
Sorting and Analyzing
Students explore sorting and graphing. In this math lesson plan, students create and analyze a class bar graph about their birthday months. They then estimate and sort candies to make and analyze their own bar graph.
Curated OER
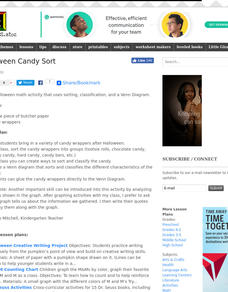
Halloween Candy Sort
Learners use their Halloween candy to practice sorting and classifying. They compete a Venn diagram comparing their candy wrappers. They develop ways as a class to catorgize the candy in different ways.
Curated OER
Valentine Candy Count
Here is an imaginative take on a classic lesson! Young scholars discover what color Valentine Candy is found more often than any other in a standard bag of Valentine Conversation Hearts. They observe, predict, sort, and classify the data...
Curated OER
Data With Candy
Students, while utilizing the classroom and the computer lab with a bag of colored candy, gather and interpret data, calculate averages and draw conclusions and draw a bar graph. They estimate how many candies are in the bag, what...
Curated OER
Valentine Heart Candy
Each student gets a box of candy Valentine hearts. The students open the box and count how many of each colored heart they have in their box. The students use this information to make a bar graph and answer follow-up questions.
Curated OER
Counting Candies
Students count, sort, and classify jellybeans by color. They use their data to create a bar graph. Students are given a small bag of jellybeans, and a worksheet on Counting Candies Tally Chart. They work in small groups. Students are...
Curated OER
Sorting Sweethearts
Students categorize sweetheart candy by color or message. In this sorting and graphing lesson, students collect data by sorting the candy and then diagram their results in a graph.
Curated OER
Build A Skittles Graph
Students explore graphing. In this graphing lesson, students sort Skittles candies and use the color groups to create a bar graph. Rubrics and extension activities are provided.
Curated OER
Math: Graphs and Their Symbols
Second graders examine different types of graphs and discover the meanings of the symbols used on them. After gathering data about themselves, their communities, and the world, they use that information to create graphs. Among the...
Curated OER
Algebra: Sorting, Representing, and Patterns
Students sort objects and create patterns. In this sorting and graphing lesson plan, students work at centers to find a way to sort a group of objects, then make a graphical representation of the number of each item. Finally, students...
Curated OER
Statistics of Mars
Students explore the concept of central tendencies. In this central tendencies lesson, students sort M&M's or Skittles based on color. Students graph their results. Students find the mean, median, and mode of their data.
Curated OER
Graphing Conversation Hearts
Students collect data and create a graph. In this mathematics lesson, students separate paper hearts by color and create a graph showing the number of hearts of each color present. Students receive a handful of candy hearts that...
Curated OER
Which Graph is best?
Students use commercial software to organize and visually display data to draw conclusions; students use graphing software to create several types of graphs illustrating the number of each color of M&M's in one bag.
Curated OER
Sweet Data
Students input data about the colors of their serving of M&M candies onto a spreadsheet. They create charts and graphs based on this information.
Curated OER
Gummy Bear Math
First graders predict, collect data, and create a graph based on gummy bear colors they are given. In this graphing lesson plan, 1st graders first predict how many colors of gummy bears there are. They then count the colors, graph them,...
Curated OER
Candy Math
Second graders in a special education classroom sort candies by color. In groups, they complete various addition problems with the candy and create graphs. They compare and contrast the amounts of candies and answer questions on a...
Curated OER
Valentine Candy Count
Students investigate what color Valentine Candy is found more often than any other in a standard bag of "Valentine Conversation Hearts." They sort, classify and graph their findings.
Curated OER
Candy Fractions
Second graders complete math activities with donated seasonal treats. They estimate, count, sort, name and graph bags of treats. They can eat treats when finished.
Curated OER
Candy Math
Second graders sort candies by color. They also complete various addition problems using candy pieces and complete a graph using those candies. They compare and contrast the selected amounts of candies.
Curated OER
Valentine Candy Count
Students analyze a bag of Valentine candy to create a graph. In this graphing lesson, students make predictions, sort by color, record data and make a graph. Students discuss results and make generalizations. Students generate their own...
Curated OER
M&Ms; Line Plots and Graphing
Students, using small individual bags of M&Ms, engage in activities including; estimating, sorting, graphing, mean, median, mode, fractions, percentage, and averaging.


