Curated OER
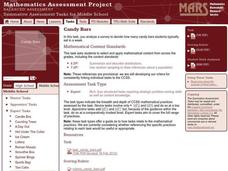
Candy Bars
There is often more to data than meets the eye. Scholars learn that they need to analyze data before making conclusions as they look at data that describes the number of candy bars boys and girls eat. They disprove a given conclusion and...
Yummy Math
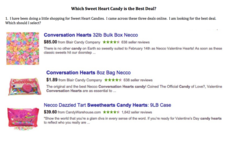
Which Sweet Heart Candy Is the Best Deal?
Get the most Valentine's candy for your money with a fun math activity! After examining three deals for buying candy hearts in bulk, young mathematicians decide which deal is the best and use bar graphs to demonstrate their claim. They...
David Pleacher
Candy Math Fun
Few things can motivate children to learn like the promise of a sweet and tasty treat. Given a bag of M&M®s, Skittles®, or other colorful candy, students first predict the contents of the bag before counting the pieces,...
Math Drills
Trick-Or-Treat Candy Probabilities
Class members satisfy their sweet tooth with a Halloween-themed, candy probability activity. Using images of candy pieces that represent data, young mathematicians find the probability of getting different pieces of candy while...
Curriculum Corner
Learning Fun with Hershey Bars
Compiled of 18 task cards and five worksheets, young mathemmaticians practice solving fraction word problems and other fraction-based activities with a Hershey Bar. The packet comes with sheets to record and keep track of all of the task...
Mathematics Assessment Project
Buying Chips and Candy
As a middle school assessment task, learners first two write equations representing their purchase of chips and candy bars. They then solve the system of equations to find the price of each item.
Curated OER
M&M’s Math Worksheet
Who knew you could cover prediction, histograms, fractions, decimals, data collection, and averages (mean, median, and mode) all with a bag of M&M's®? Here's a fantastic set of worksheets to help you make candy a mathematical journey...
Curated OER
Tim and Pat at the Store: Bar Graphs
Do you like candy? Tim and Pat go to the candy store every day after school. Can you use the chart to determine how much money they spend each day? Does one spend more than the other?
Illustrative Mathematics
Buying Protein Bars and Magazines
Packing for a trip? This activity allows learners to decide how many magazines and protein bars they can buy with twenty dollars. They can organize their work in a chart to track how many items they can purchase. There are two different...
Curated OER
Candy Land
In this candy worksheet, students read clues and determine the name of the candy bar it describes. This one-page worksheet contains 26 problems. Answers are provided.
Curated OER
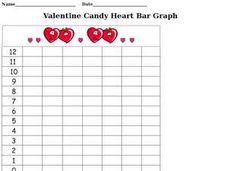
Valentine Candy Heart Bar Graph
In this Valentine candy heart bar graph worksheet, students complete a bar graph illustrating how many different colored candy hearts they received for Valentine's Day.
Curated OER
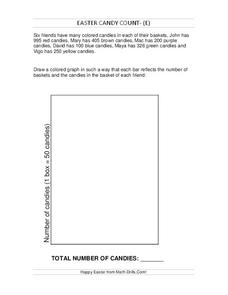
Easter Candy Count
In this bar graph worksheet, students fill in the bar graph based on the information about Easter candy that each child got. Students complete 6 spaces in the bar graph and find the total number of candies.
Curated OER
Easter Candy Count
In this bar graph worksheet, students complete a bar graph based on the information of Easter candy they are given for each color. Students complete 6 spaces in the bar graph and find the total.
Rational Number Project
Initial Fraction Ideas Lesson 9 Overview
Visual models support young mathematicians with exploring equivalent fractions. Starting with a quick warm-up problem, children go on to work through a series of guiding practice problems before working with a partner identifying and...
Curated OER
Using Averages
In this math worksheet, students compute the range, mean, median and modal weight of candy bars from two machines. Students write a short essay about which machine is using too much chocolate and which is more reliable.
Curated OER
Easter Candy Count
In this bar graph learning exercise, students fill in the bar graph with the information of Easter candy that each child has and find the total. Students fill in 6 bars in the bar graph.
Curated OER
Easter Candy Count
In this bar graph learning exercise, learners complete a bar graph based on the information of Easter candy they are given for each color. Students complete 6 spaces in the bar graph and find the total.
Curated OER
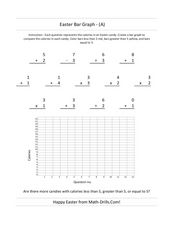
Easter Bar Graph- A
In this Easter math worksheet, students first solve 13 problems with addition, subtraction, multiplication and division. Using the answers, students make a bar graph.
Curated OER
Easter Bar Graph - C
In this math review learning exercise, students complete addition, multiplication, division, and subtraction problems where each answer is inserted into a bar graph. Students complete 13 problems.
Curated OER
Easter Bar Graph - (E)
In this math review worksheet, students complete addition, multiplication, division, and subtraction problems where each answer is put into an Easter bar graph. Students complete 13 problems.
Curated OER
Easter Bar Graph - (B)
In this math review worksheet, students complete addition, subtraction, multiplication, and division problems and put their answers into a bar graph that represents calories. Students complete 13 problems and 1 graph.
Curated OER
Easter Bar Graph - (D)
In this math review worksheet, students complete addition, multiplication, division, and subtraction problems where each answer is put into an Easter bar graph. Students complete 13 problems.
Curated OER
Easter Candy Count
In this bar graph learning exercise, students complete a bar graph based on the information of Easter candy they are given for each color. Students complete 6 spaces in the bar graph and find the total.
Curated OER
Skittle Math
In this skittle math worksheet, young scholars sort skittles by color and create a bar graph for each color of skittle. Students also answer comparison, ratio, and relationship questions about the skittles.
