Curated OER
Between The Extremes
Students analyze graphs for specific properties. In this algebra lesson, students solve equations and graph using the TI calculator. They find the different changes that occur in each graph,including maximum and minimum.
Curated OER
Coordinate Geometry
In this geometry worksheet, students calculate the midpoint and distance between two points. They use the correct formula to solve the area and perimeter of polygons. There are 20 multiple choice questions with an answer key.
Curated OER
Relating Distance and Velocity Over Time
Learners calculate the distance and velocity over time. In this algebra lesson plan, students graph a linear function to represent the distance vers time travel. They interpret their graphs and draw conclusion.
Curated OER
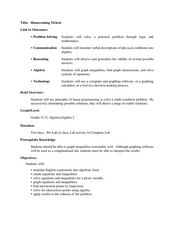
Homecoming Tickets
Students solve word problems using systems of equation. In this algebra lesson, students use computer and graphing to graph and analyze their solution. They solve system involving inequalities.
Curated OER
What Are The Chances
Students calculate the probability of an event occurring. In this probability instructional activity, students differentiate between independent, dependent or compound events. They find the range of the data.
Curated OER
Slip Slide'n Away
Students analyze the sliding of boxes along a warehouse floor. In this algebra instructional activity, students connect math and physics by calculating the friction created by the sliding of each box. They develop faster method to move...
Curated OER
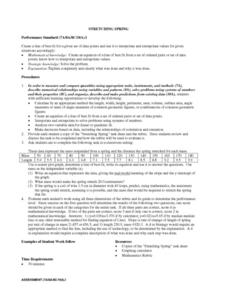
STRETCHING SPRING
Students calculate the length, width, height, perimeter, area, volume, surface area, angle measures or sums of angle measures of common geometric figures. They create an equation of a line of best fit from a set of ordered pairs or...
Curated OER
Slope & Rate of Change
This short handout addresses the concept of slope in two different ways: geometrically and analytically. Start with a brief description of slope, then use graphical representations to compare positive vs. negative slope and zero vs....
Curated OER
Means of Growth
Students collect and graph data. In this statistics lesson, students analyze their plotted data using a scatter plot. They identify lines as having positive, negative or no correlation.
Curated OER
Conductivity of salt Solutions
Learners investigate the concentration level of solutions. In this math/science instructional activity, students identify three different ionic compounds. They predict the conductivity of each using their collected data.
Curated OER
La Toteca- A Tropical Paradise
Students collect data on the time of the ferry. In this algebra lesson, students use the data to predict a ferry schedule. They also compute the depth where oxygen would be needed when diving.
Curated OER
How High Are the Clouds?
Pupils analyze height and collect data to create a graph. In this statistics lesson, students use central tendencies to analyze their data and make predictions. They apply concept of statistics to other areas of academics to make a...


