Council for Economic Education
Loan Amortization - Mortgage
When you buy a home for $100,000, you pay $100,000—right? On the list of important things for individuals to understand, the lesson presents the concept of interest rates and loan amortization using spreadsheets and online sources....
Pingry School
Solubility Product of an Ionic Compound
How do scientists determine when a solution is fully saturated? Scholars address the topic as they observe patterns of precipitation in various concentrations of ions. Using a well plate, pipette, and common chemicals, they collect data...
Virginia Department of Education
Box-and-Whisker Plots
The teacher demonstrates how to use a graphing calculator to create box-and-whisker plots and identify critical points. Small groups then create their own plots and analyze them and finish by comparing different sets of data using box...
Curated OER
Making Predictions from Data with a Graphing Calculator
In this making predictions from data worksheet, students solve 15 short answer problems. Students determine average miles per gallon given data on miles traveled and gas used. Students make predictions using the data and a line of best fit.
Curated OER
What's Your Hypothesis?
Find the article, "In the Thick of Air Pollution," not through the resource link in the lesson, but through an Internet search. Have high schoolers read it and perform calculations with the statistics provided. The objective is to...
Curated OER
Heartbeat Project
Learners enter information about their heartbeats into a spreadsheet. They construct data displays and calculate statistics. They describe and justify their conclusions from the data collected.
Curated OER
Mean, Median, and Mode
Eighth graders practice using the LIST key on graphing calculators using the proper syntax. They work with the functions of mean, median, and mode in a teacher led instructional activity and then with a partner on a second data set. They...
Curated OER
Understanding the Mole
Students develop an understanding of the mole and molar masses of elements. In this mole lesson plan, students use beans to find their relative masses and draw parallels to the atomic masses of elements. Students work in teams and each...
Curated OER
Macbeth Madness
Students research Macbeth online and complete computer and graphing activities for the play. In this Macbeth activities lesson, students research Macbeth and bookmark the URL's. Students complete activities for the topic on spreadsheets...
Curated OER
Memory in Your World
Students rotate through three classroom stations and identify similarities and differences between machines with and without memory, such as typewriters and computers, and illustrate how machines with memory fit into their world.
Curated OER
Cannonball
Students calculate the speed, motion and distance of a projectile. In this geometry lesson, students obtain measurements while calculating velocity. They graph their results and make predictions.
Curated OER
Applications of Parabolas
In this algebra learning exercise, 11th graders rewrite word problems using algebraic symbols. They relate parabolas to the real world and calculate the breaking distance using the distance formula they come up with. There is answer key.
Curated OER
How Does a Migration Move Forward?
Students record and examine migration data, and calculate how fast and far a migrating animal travels and what influences its progression. They utilize the Journey North website to follow their migrating animals.
Curated OER
The Doctrine of Signatures
Students use the graphing calculator and the core equation: y=Ax^2+Bx+C where A = the acceleration of gravity/2, B = the initial velocity, and C = initial height above ground to graph parabolas for Earth and Mars. They experiment with...
Curated OER
Neuron Anatomy Comparison
Young scholars create a scale model of a motor neuron that is two hundred times larger than the actual neuron. They identify the structures of a neuron and observe neurons under the microscope then use a worksheet to convert actual...
Curated OER
Chapter 6: The Human Population: Demographics
Students read the indicated text and complete several suggested labs and activities. They answer critical thinking questions. This instructional activity is very hard to do without the indicated text.
Curated OER
The Nucleus / Nuclear Reactions and Elementary Particles
Students describe how radioactivity relates to alpha and beta particles. Using their properties, they write a descriptive paper about the gamma rays and alpha and beta particles. They calculate q-values and the half-life of a given...
Curated OER
Select a Sound: RCX Programming
Students program an RCX to play one sound if a touch sensor is pressed down and another if it is not pressed. They write the program to repeat twenty times and incorporate the use of both a fork and a loop.
Curated OER
How is the Game Played in an Economics Class?
Students research companies, choose stocks, and create portfolios online while playing the stock market game.
Curated OER
Proof of Identity
High schoolers explore trigonometric identities. In this Algebra II lesson, students use graphing to verify the reciprocal identities. Using Cabri Jr, high schoolers investigate the Pythagorean trigonometric identities...
EngageNY
Ruling Out Chance (part 3)
Pupils analyze group data to identify significant differences. They use simulation to create their own random assignment data for comparison.
Curated OER
Multiplication: Determining the Weight of Multiple Objects
Seventh graders use their knowledge of multiplication and problem solving to determine the total weight of multiple objects. In this multiplication instructional activity, 7th graders weigh various manipulatives, record the weight, and...
Curated OER
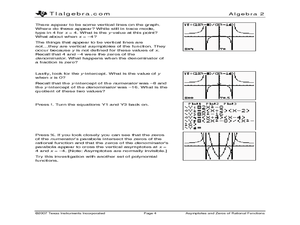
Asymptotes and Zeros
Learn how to explore rational functions and investigate the graphs rational functions and identify its singularities and asymptotes. Students approximate the solutions to rational equations and inequalities by graphing.


